See what's inside QuantAI
Your P&L calendar, AI Insights, Video Capture, the Live Risk Monitor and more, shown exactly as they look in the app. Scroll through, then start whenever you're ready.
Know why you win or lose
AI reads every trade and surfaces revenge trading, overtrading and time-of-day leaks, with dollar amounts.
See every day at a glance
A color-coded P&L calendar with the trades behind each day, plus win rate, profit factor and expectancy.
Replay the trade
Record your screens and webcam around every trade, then review the footage next to the trade itself.
Sync or upload
Connect Charles Schwab for live sync, or upload a CSV from any broker or prop firm.
Live sync with Charles Schwab. CSV import from any broker or prop firm.










Why QuantAI
Built to turn your trades into answers
Your broker shows you what happened. QuantAI shows you why, and what to change.
2 weeks
free trial on Starter and Pro, with no charge until it ends.
30 sec
to cancel from your settings page. No contracts, no fees.
15
one-click AI prompts, built with professional traders.
Any
broker or prop firm, via CSV. Schwab syncs live.
Explore the platform
Choose what you want to see
Eight tours through the app. Every screen is the real thing, and the big ones open full size when you click them.
Your whole trading picture
Win rate, profit factor and expectancy up top. A color-coded calendar underneath, with the trades behind every day.
- Daily P&L at a glance, green and red
- Stats update as your data syncs
- AI Insights, Video Capture and a live chart alongside
Available on: All plans
Ready to see your own trades like this?
Pick a plan and your dashboard is ready when you are.
Widget by widget
The dashboard, up close
Every card on your dashboard is built to answer one question fast.
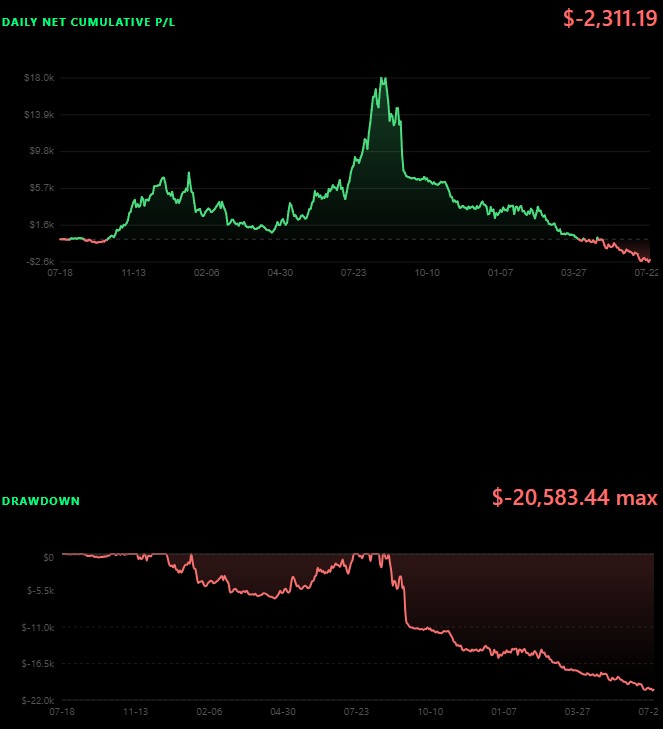
Equity curve & drawdown
Cumulative P/L with the drawdown underneath, so you see the cost of every dip.
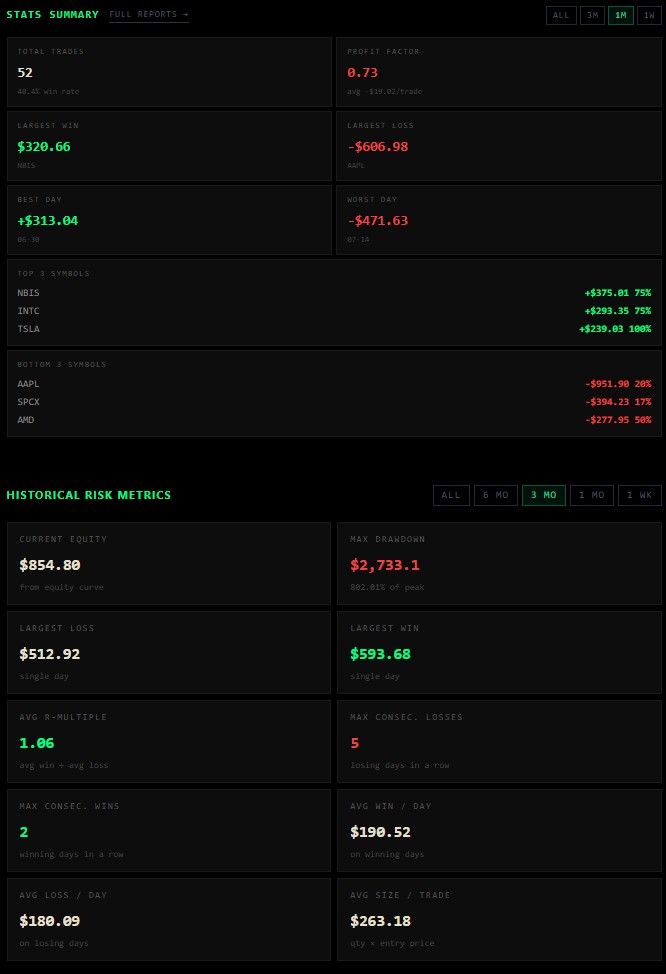
Stats summary
Profit factor, largest win and loss, best and worst day, and historical risk metrics.
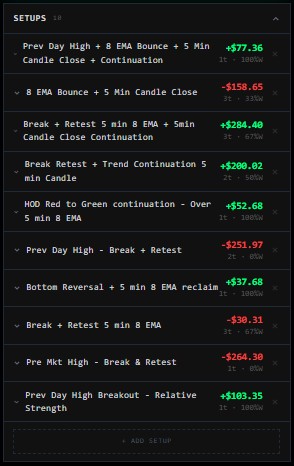
Setup tracking
P/L, trade count and win rate for every setup you log.
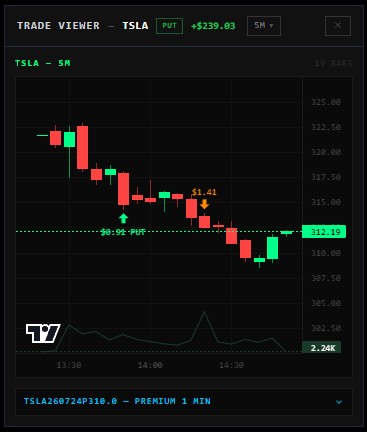
Trade Viewer
Replay any trade on its candlestick chart with entry, exit and P/L marked.
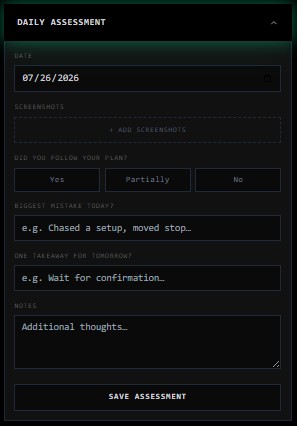
Daily Assessment
Did you follow your plan? What was the biggest mistake? One takeaway for tomorrow.
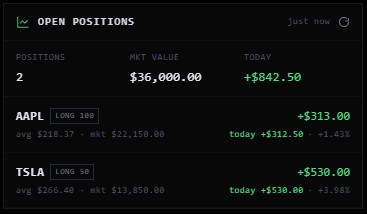
Open positions
Market value and today's P/L for every position you're holding.
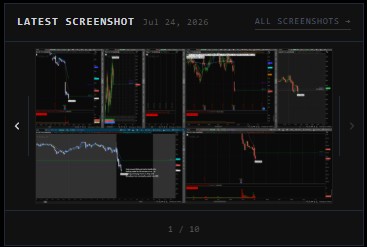
Latest screenshot
Your most recent chart captures, one click from the dashboard.
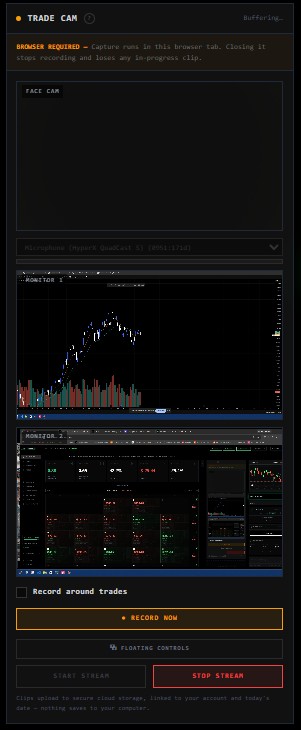
Video Capture widget
Webcam and monitor previews, plus one-click recording.
And more
The rest of the toolkit
Stylized close-ups of four more tools: Coaching, the Economic Calendar, Trending Movers and Multi-Broker Import.
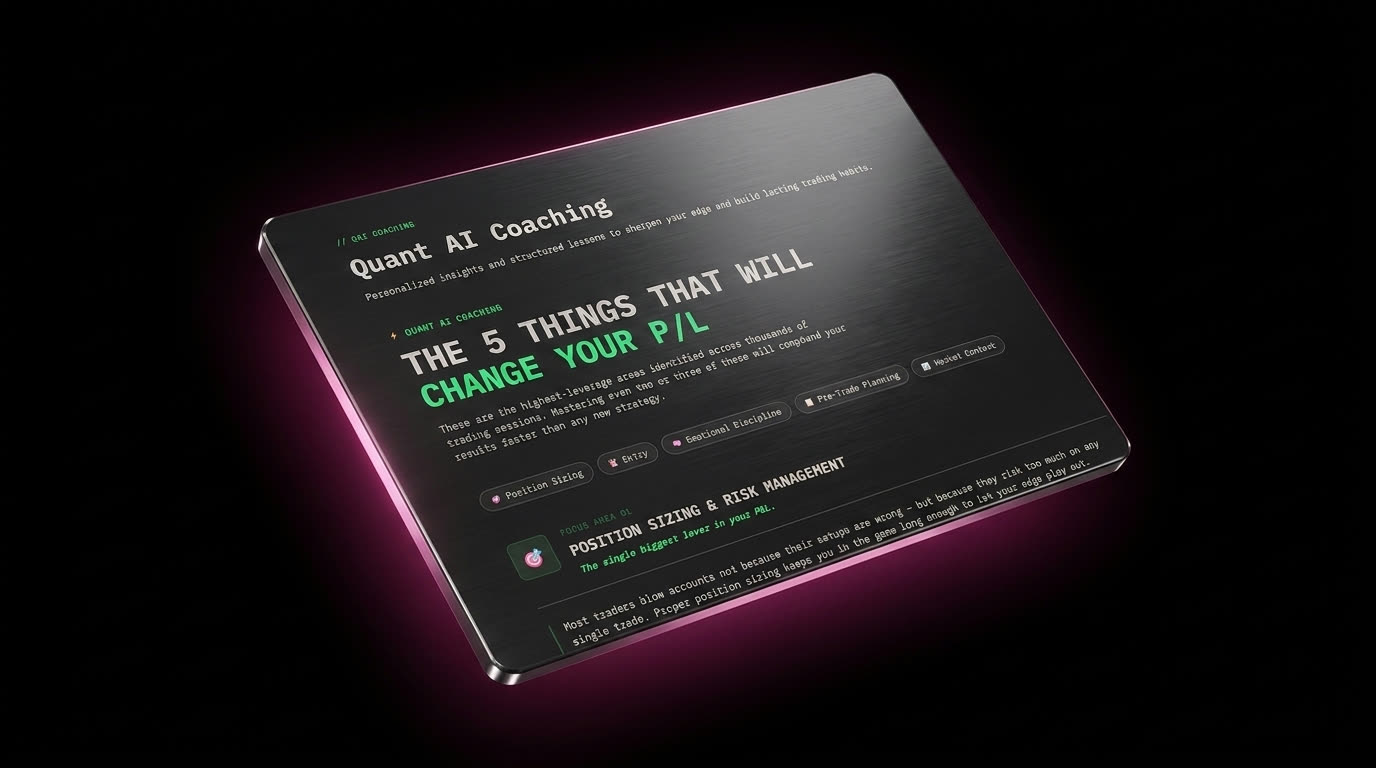
Quant AI Coaching
Personalized lessons mapped to your own P&L.
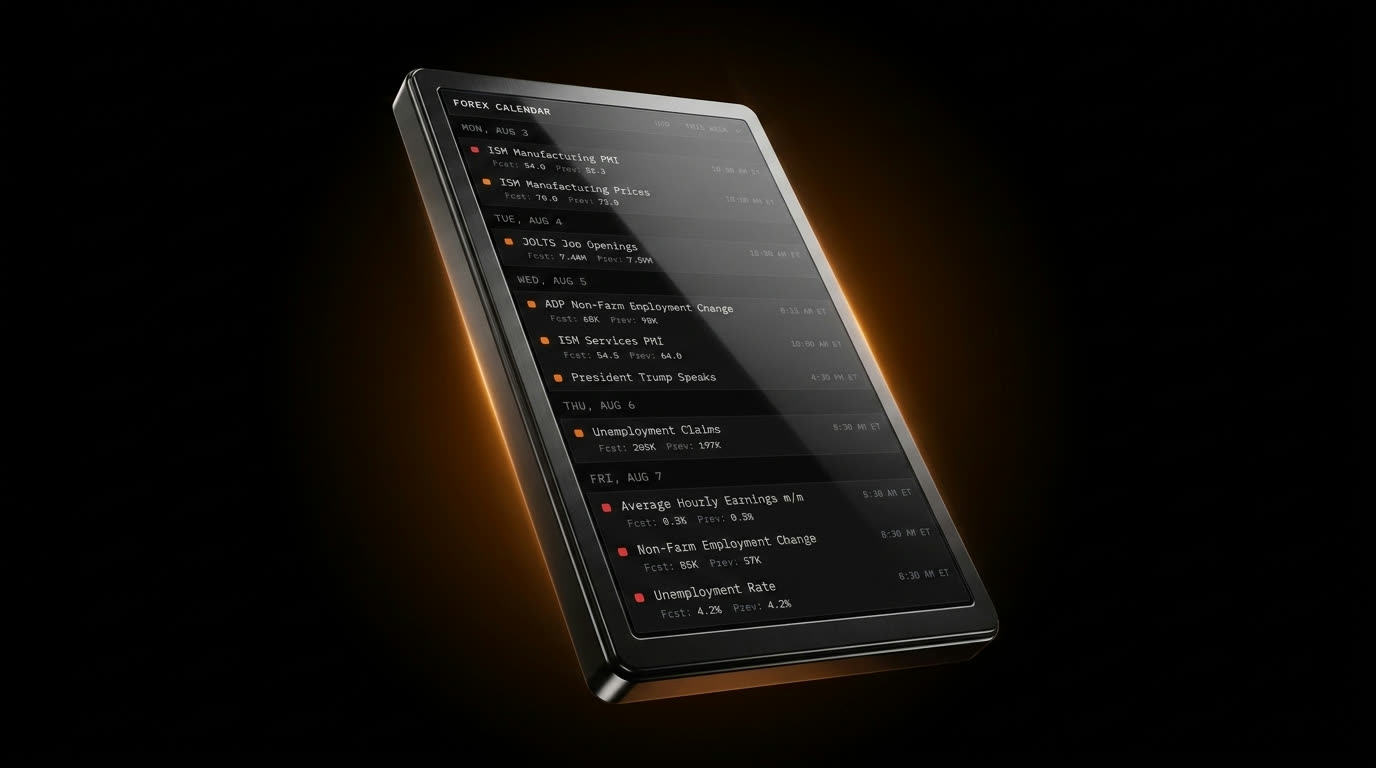
Economic Calendar
The week's high-impact macro events, forecast vs. prior.
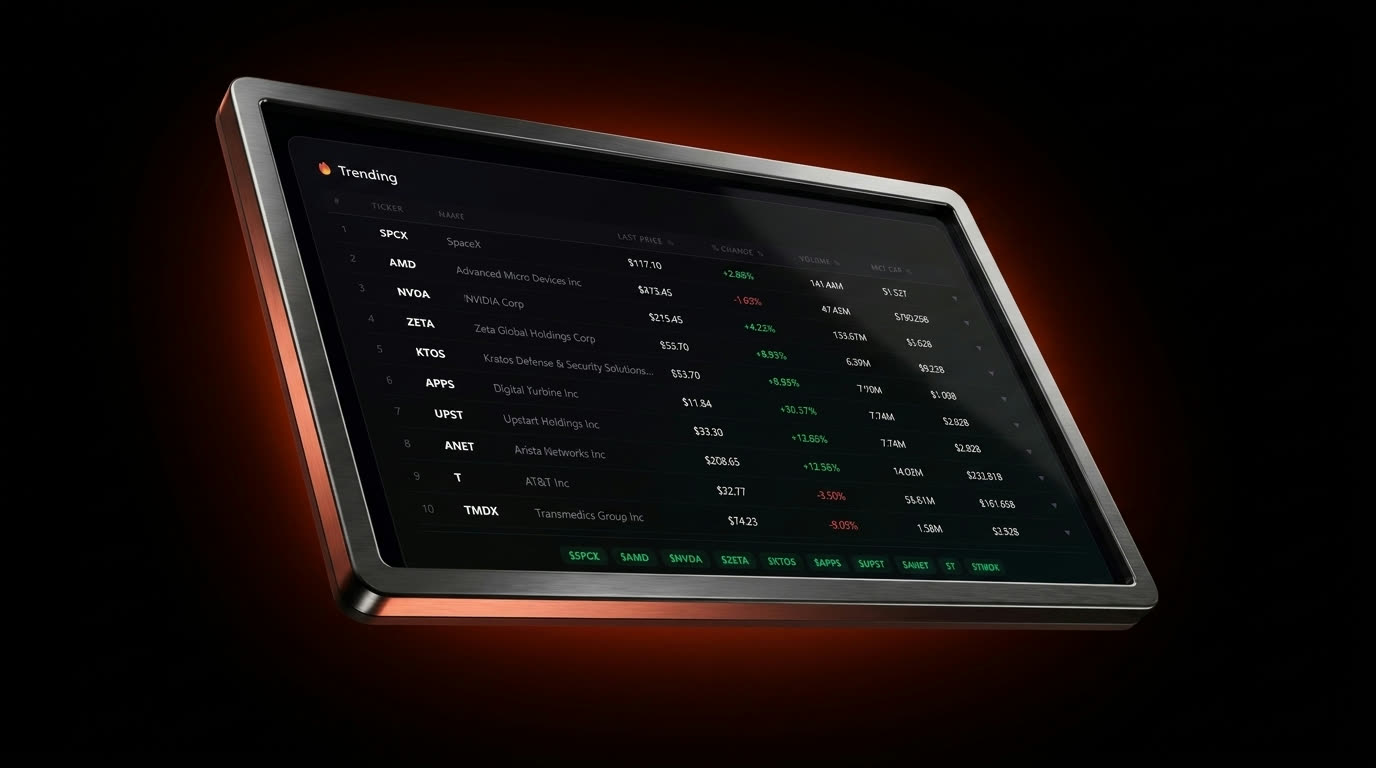
Trending Movers
Top gainers, losers and most-active tickers, live.
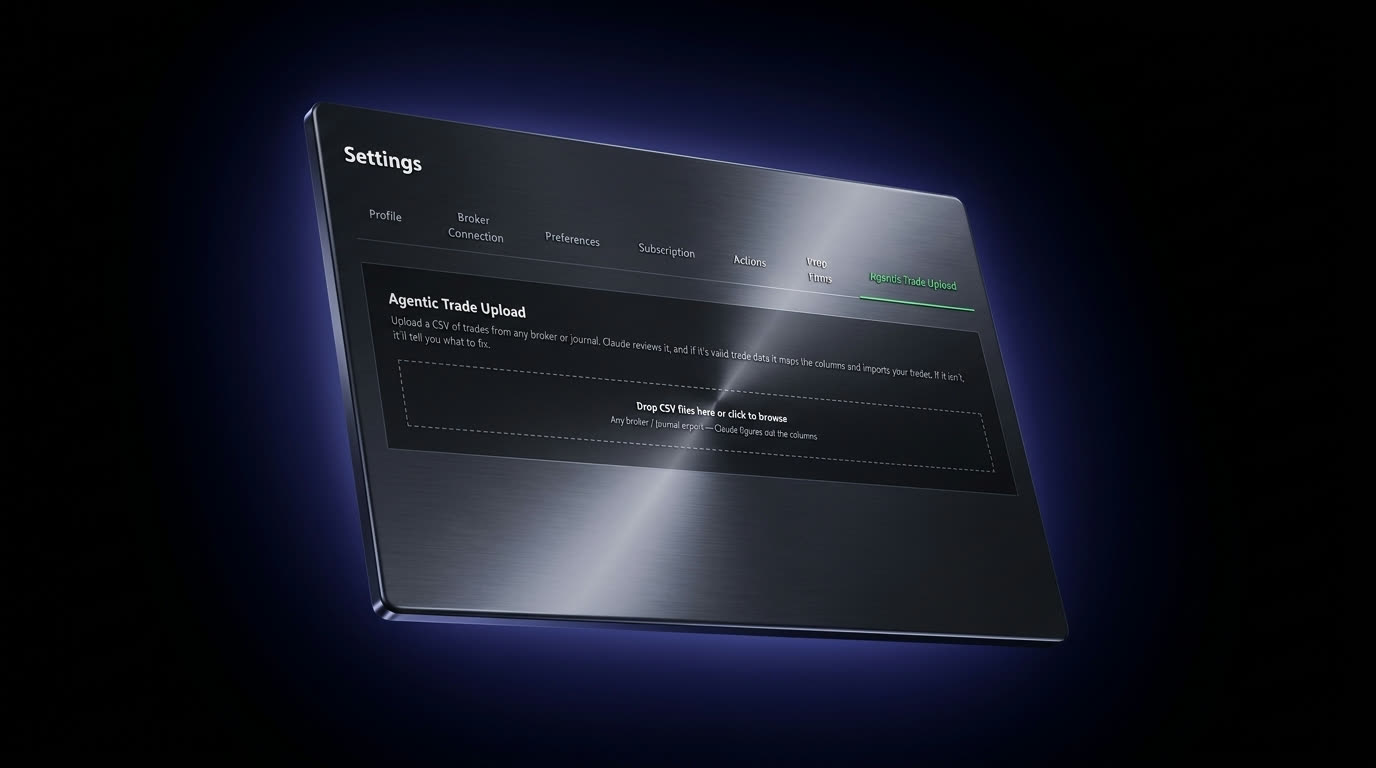
Multi-broker import
Drop in a CSV from any broker; Claude maps the columns.
Ready to get started?
Pick a plan and your dashboard is ready when you are. Starter and Pro both include a 2-week free trial.
Start NowSupported brokers
Live Schwab sync, plus CSV import for any other broker or prop firm.
See the full list