
Know Exactly Why You're
Winning or Losing
QuantAI analyzes every trade, identifies your biggest leaks, and delivers AI-powered insights that turn raw data into real edge.
Trusted by traders across brokerages

CSV + Agentic Upload








 Robinhood
What you get
Dashboard Functions
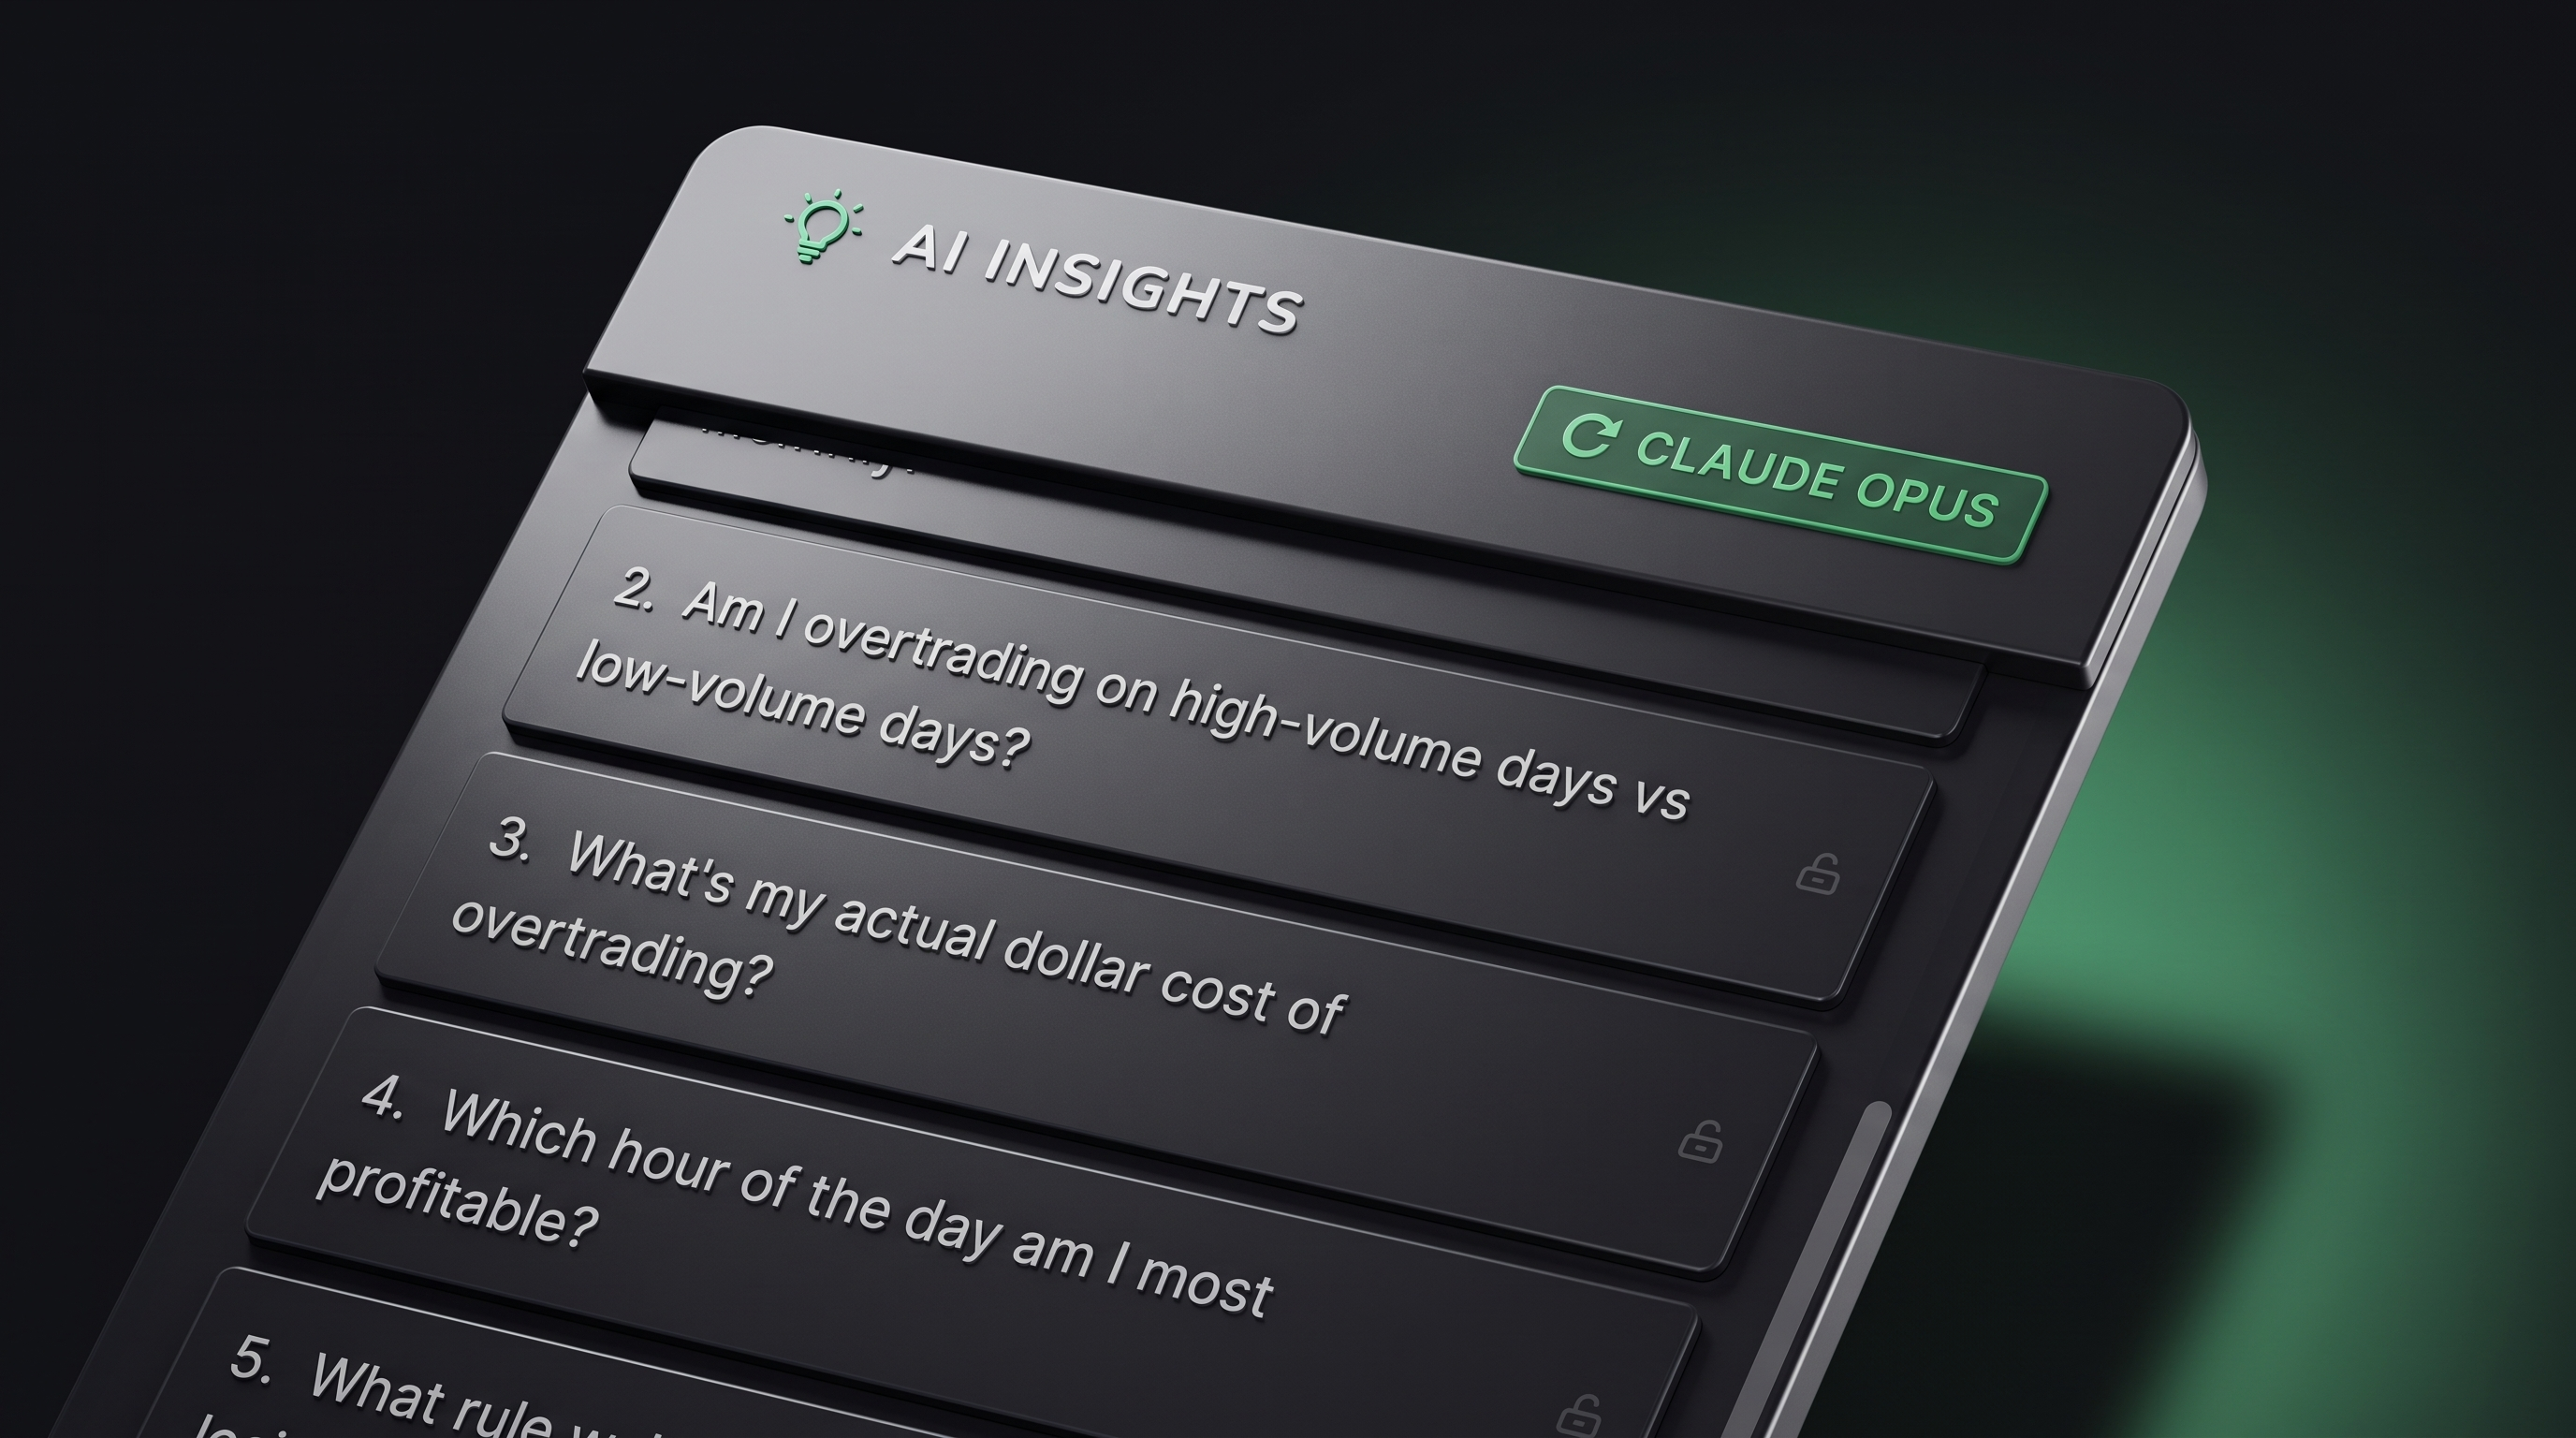
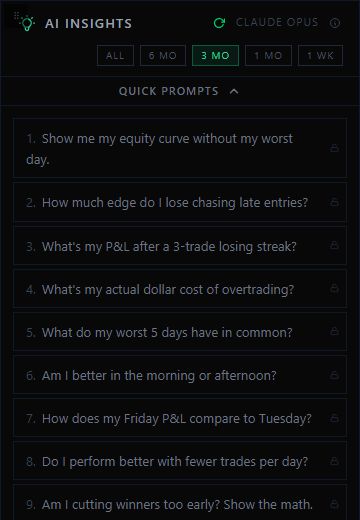
AI Trade Insights
Claude Opus analyzes your full trading history and surfaces the patterns you can't see yourself — revenge trading, overtrading, time-of-day leaks, and more.
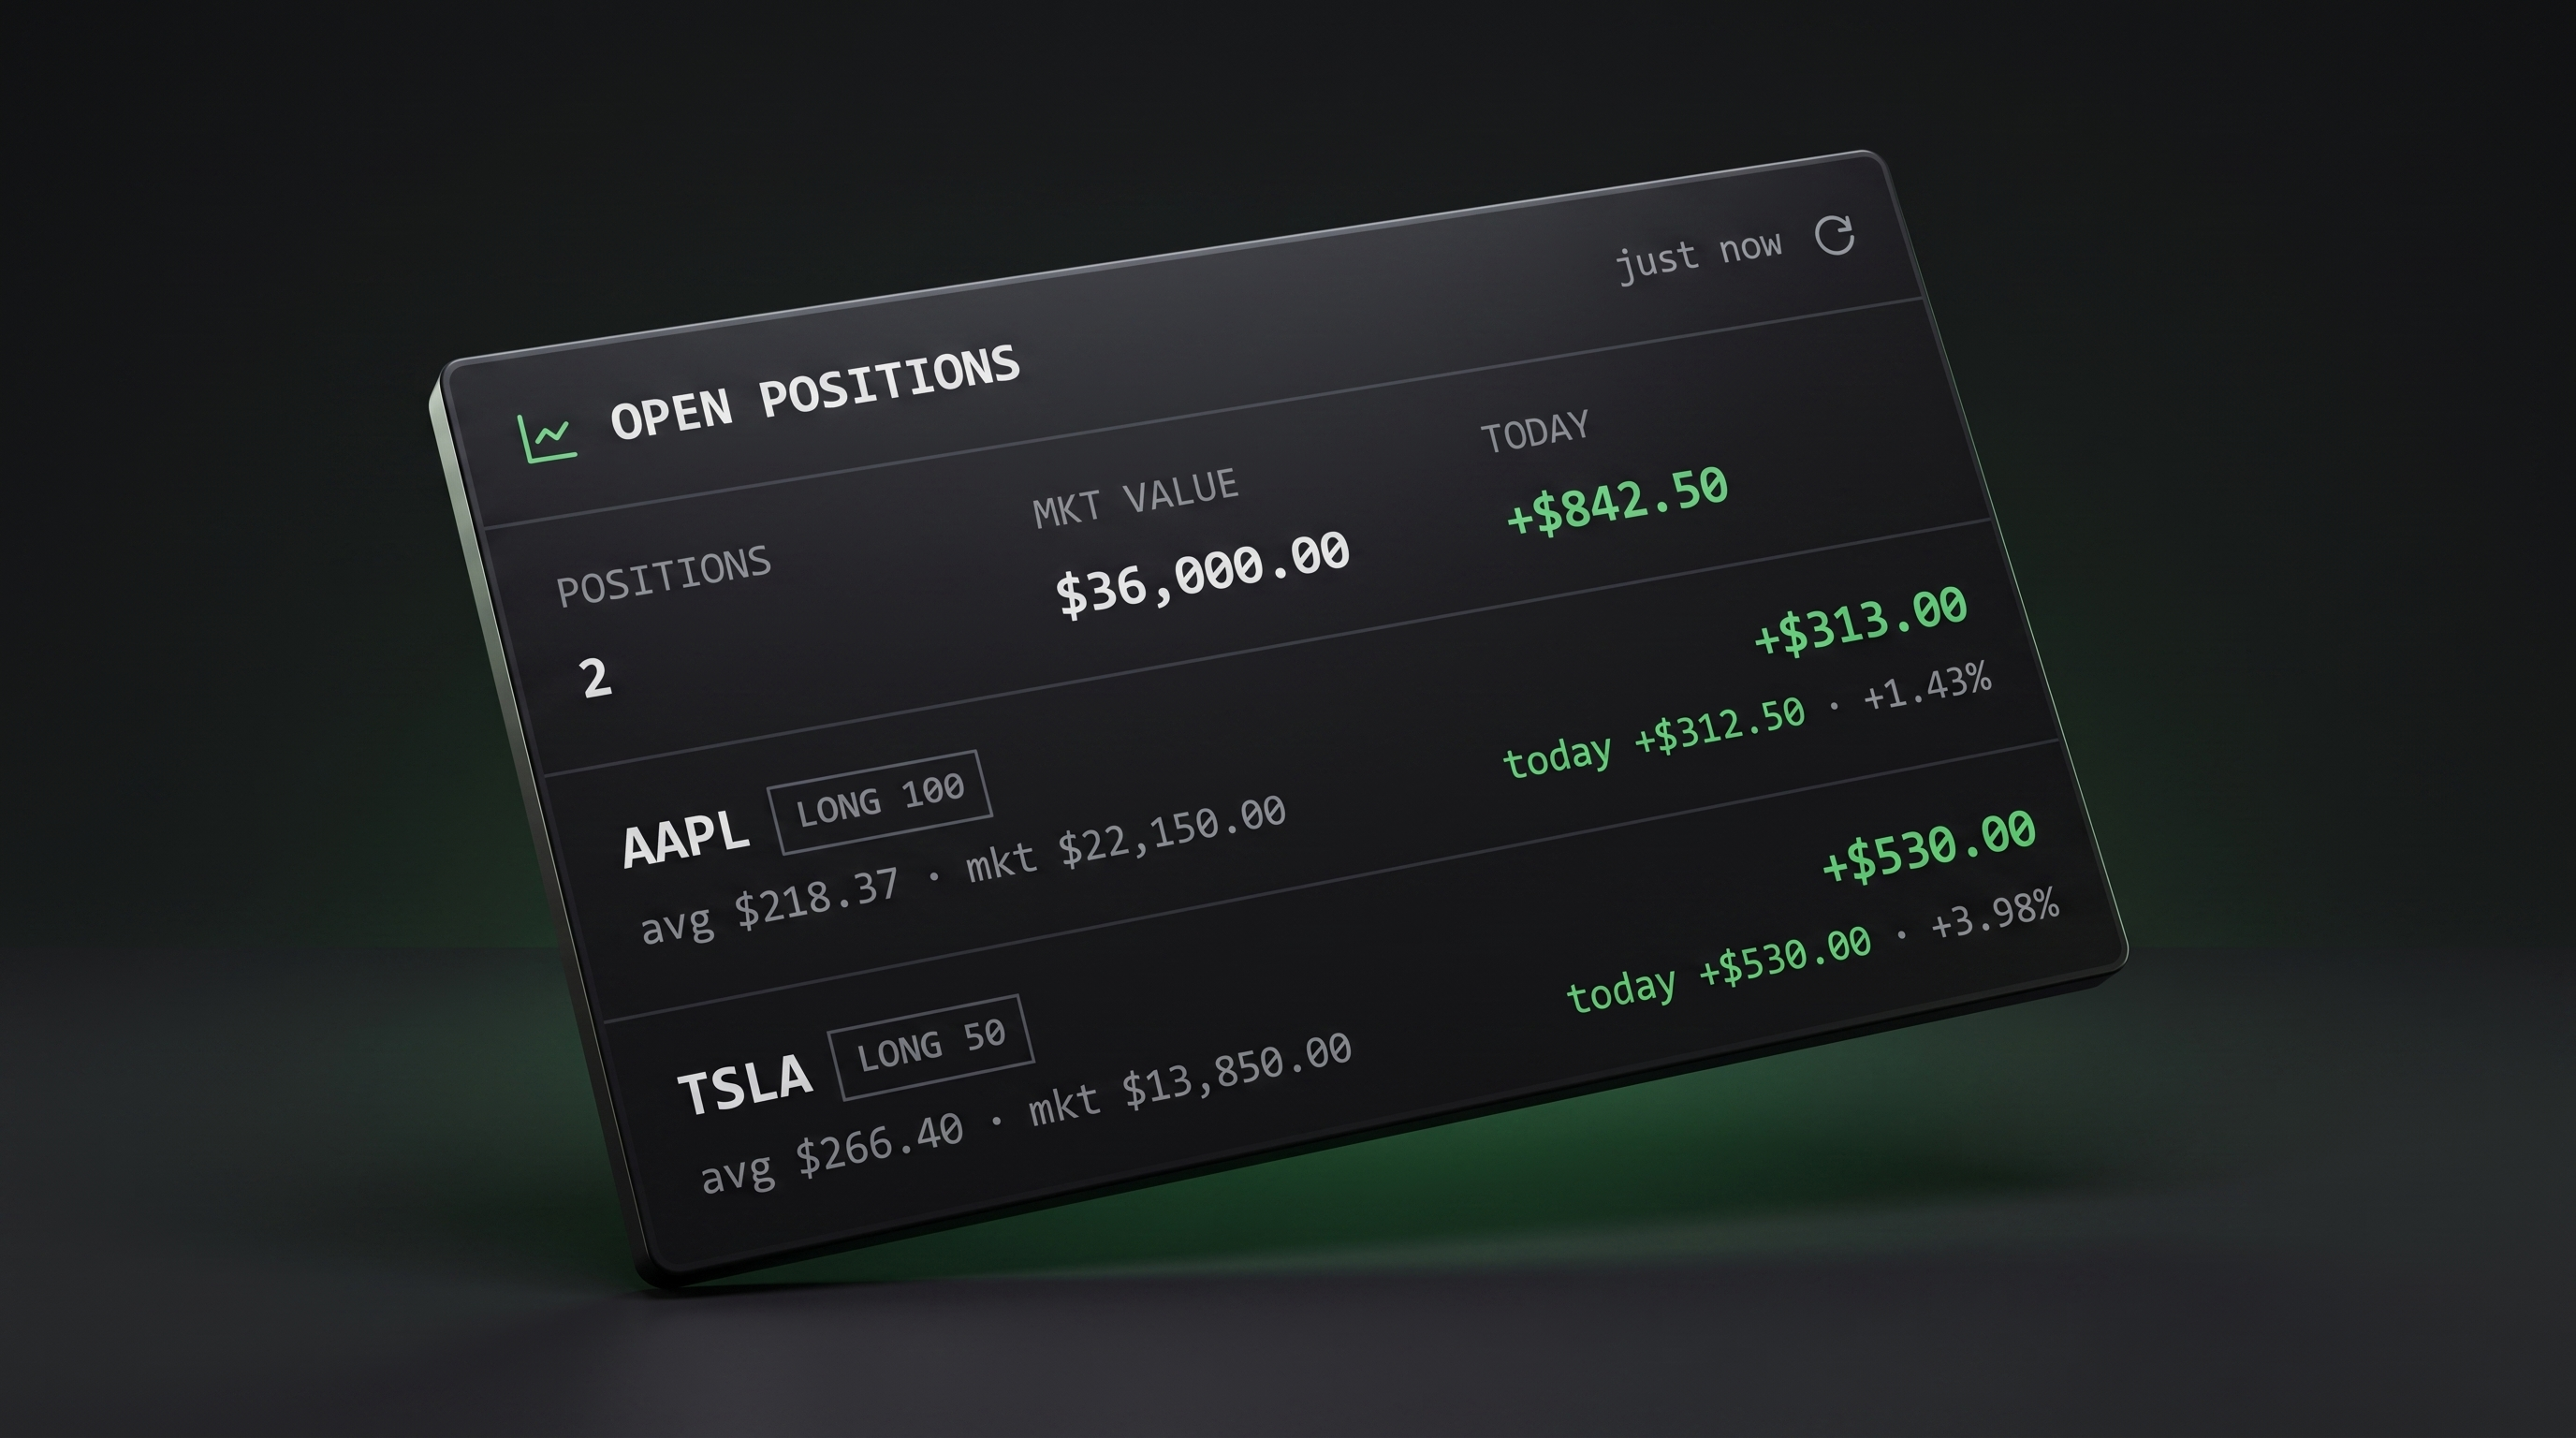
Live Broker Sync(Schwab only)
Connect your Charles Schwab account via OAuth for automatic trade syncing. Your P&L, positions, and equity curve update in real time.
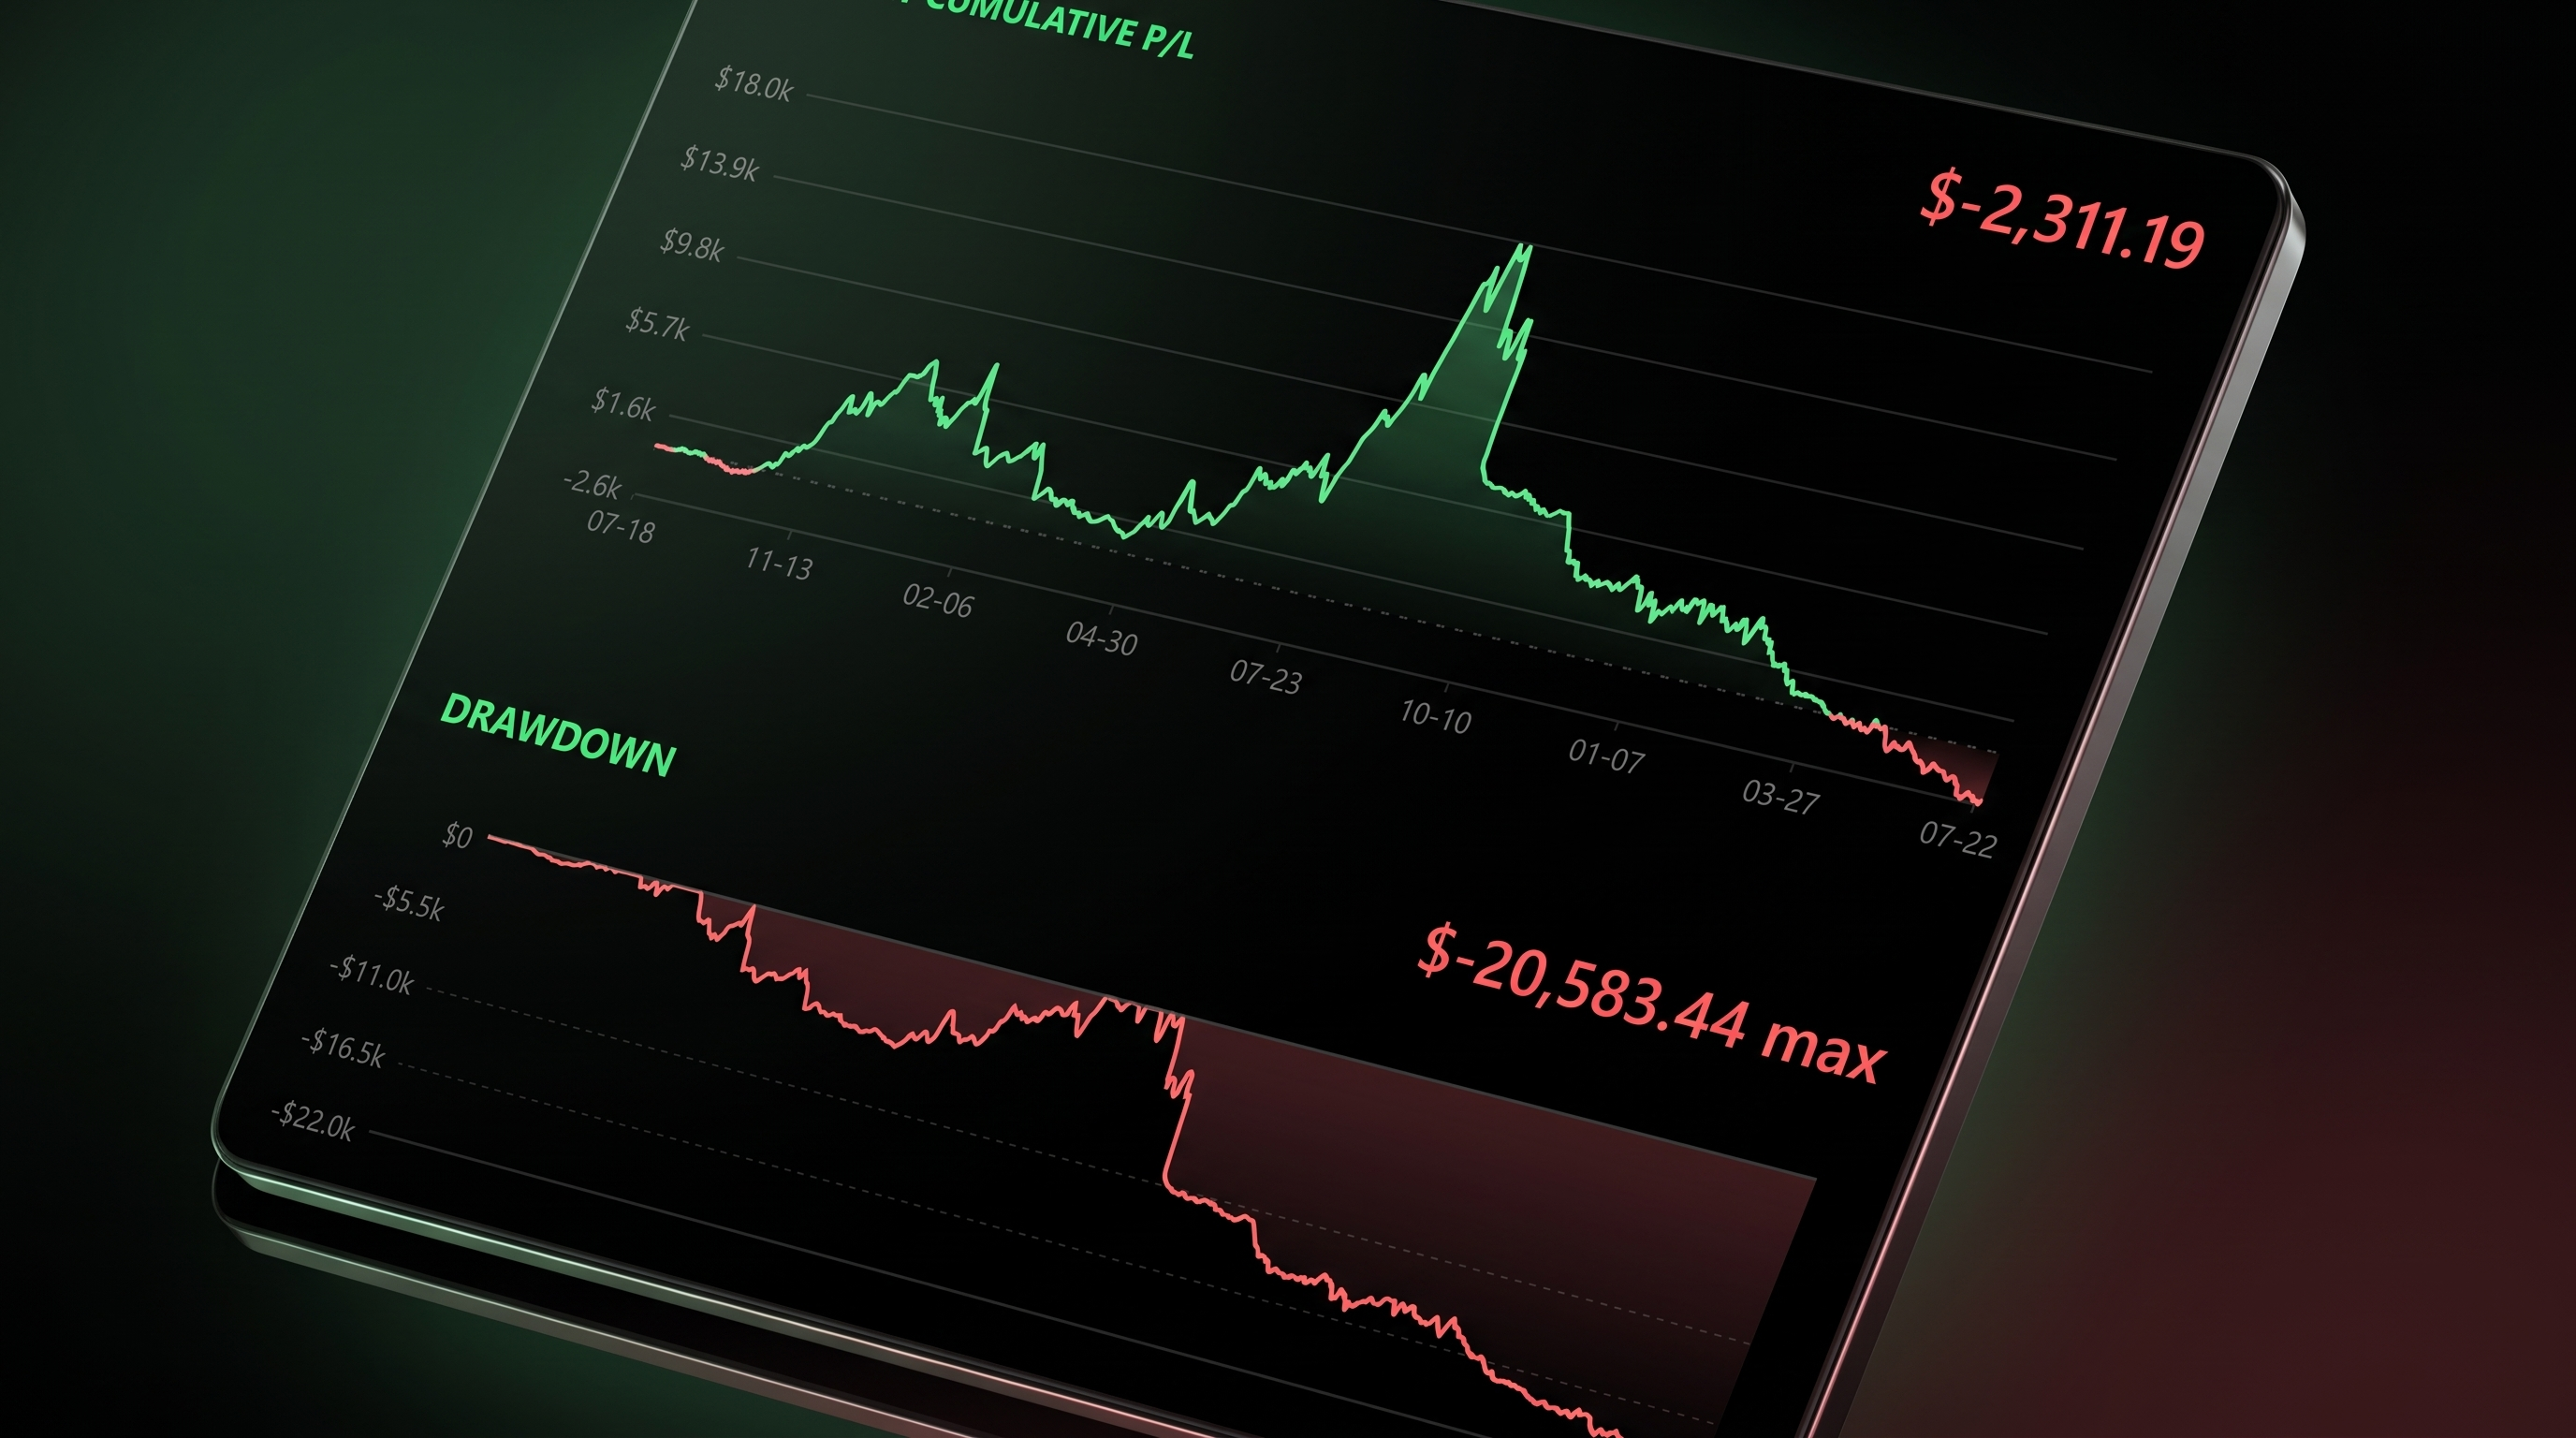
Performance Analytics
Daily P&L calendar, equity curve, win rate breakdowns by day-of-week, ticker, and session. Know where your edge actually lives.
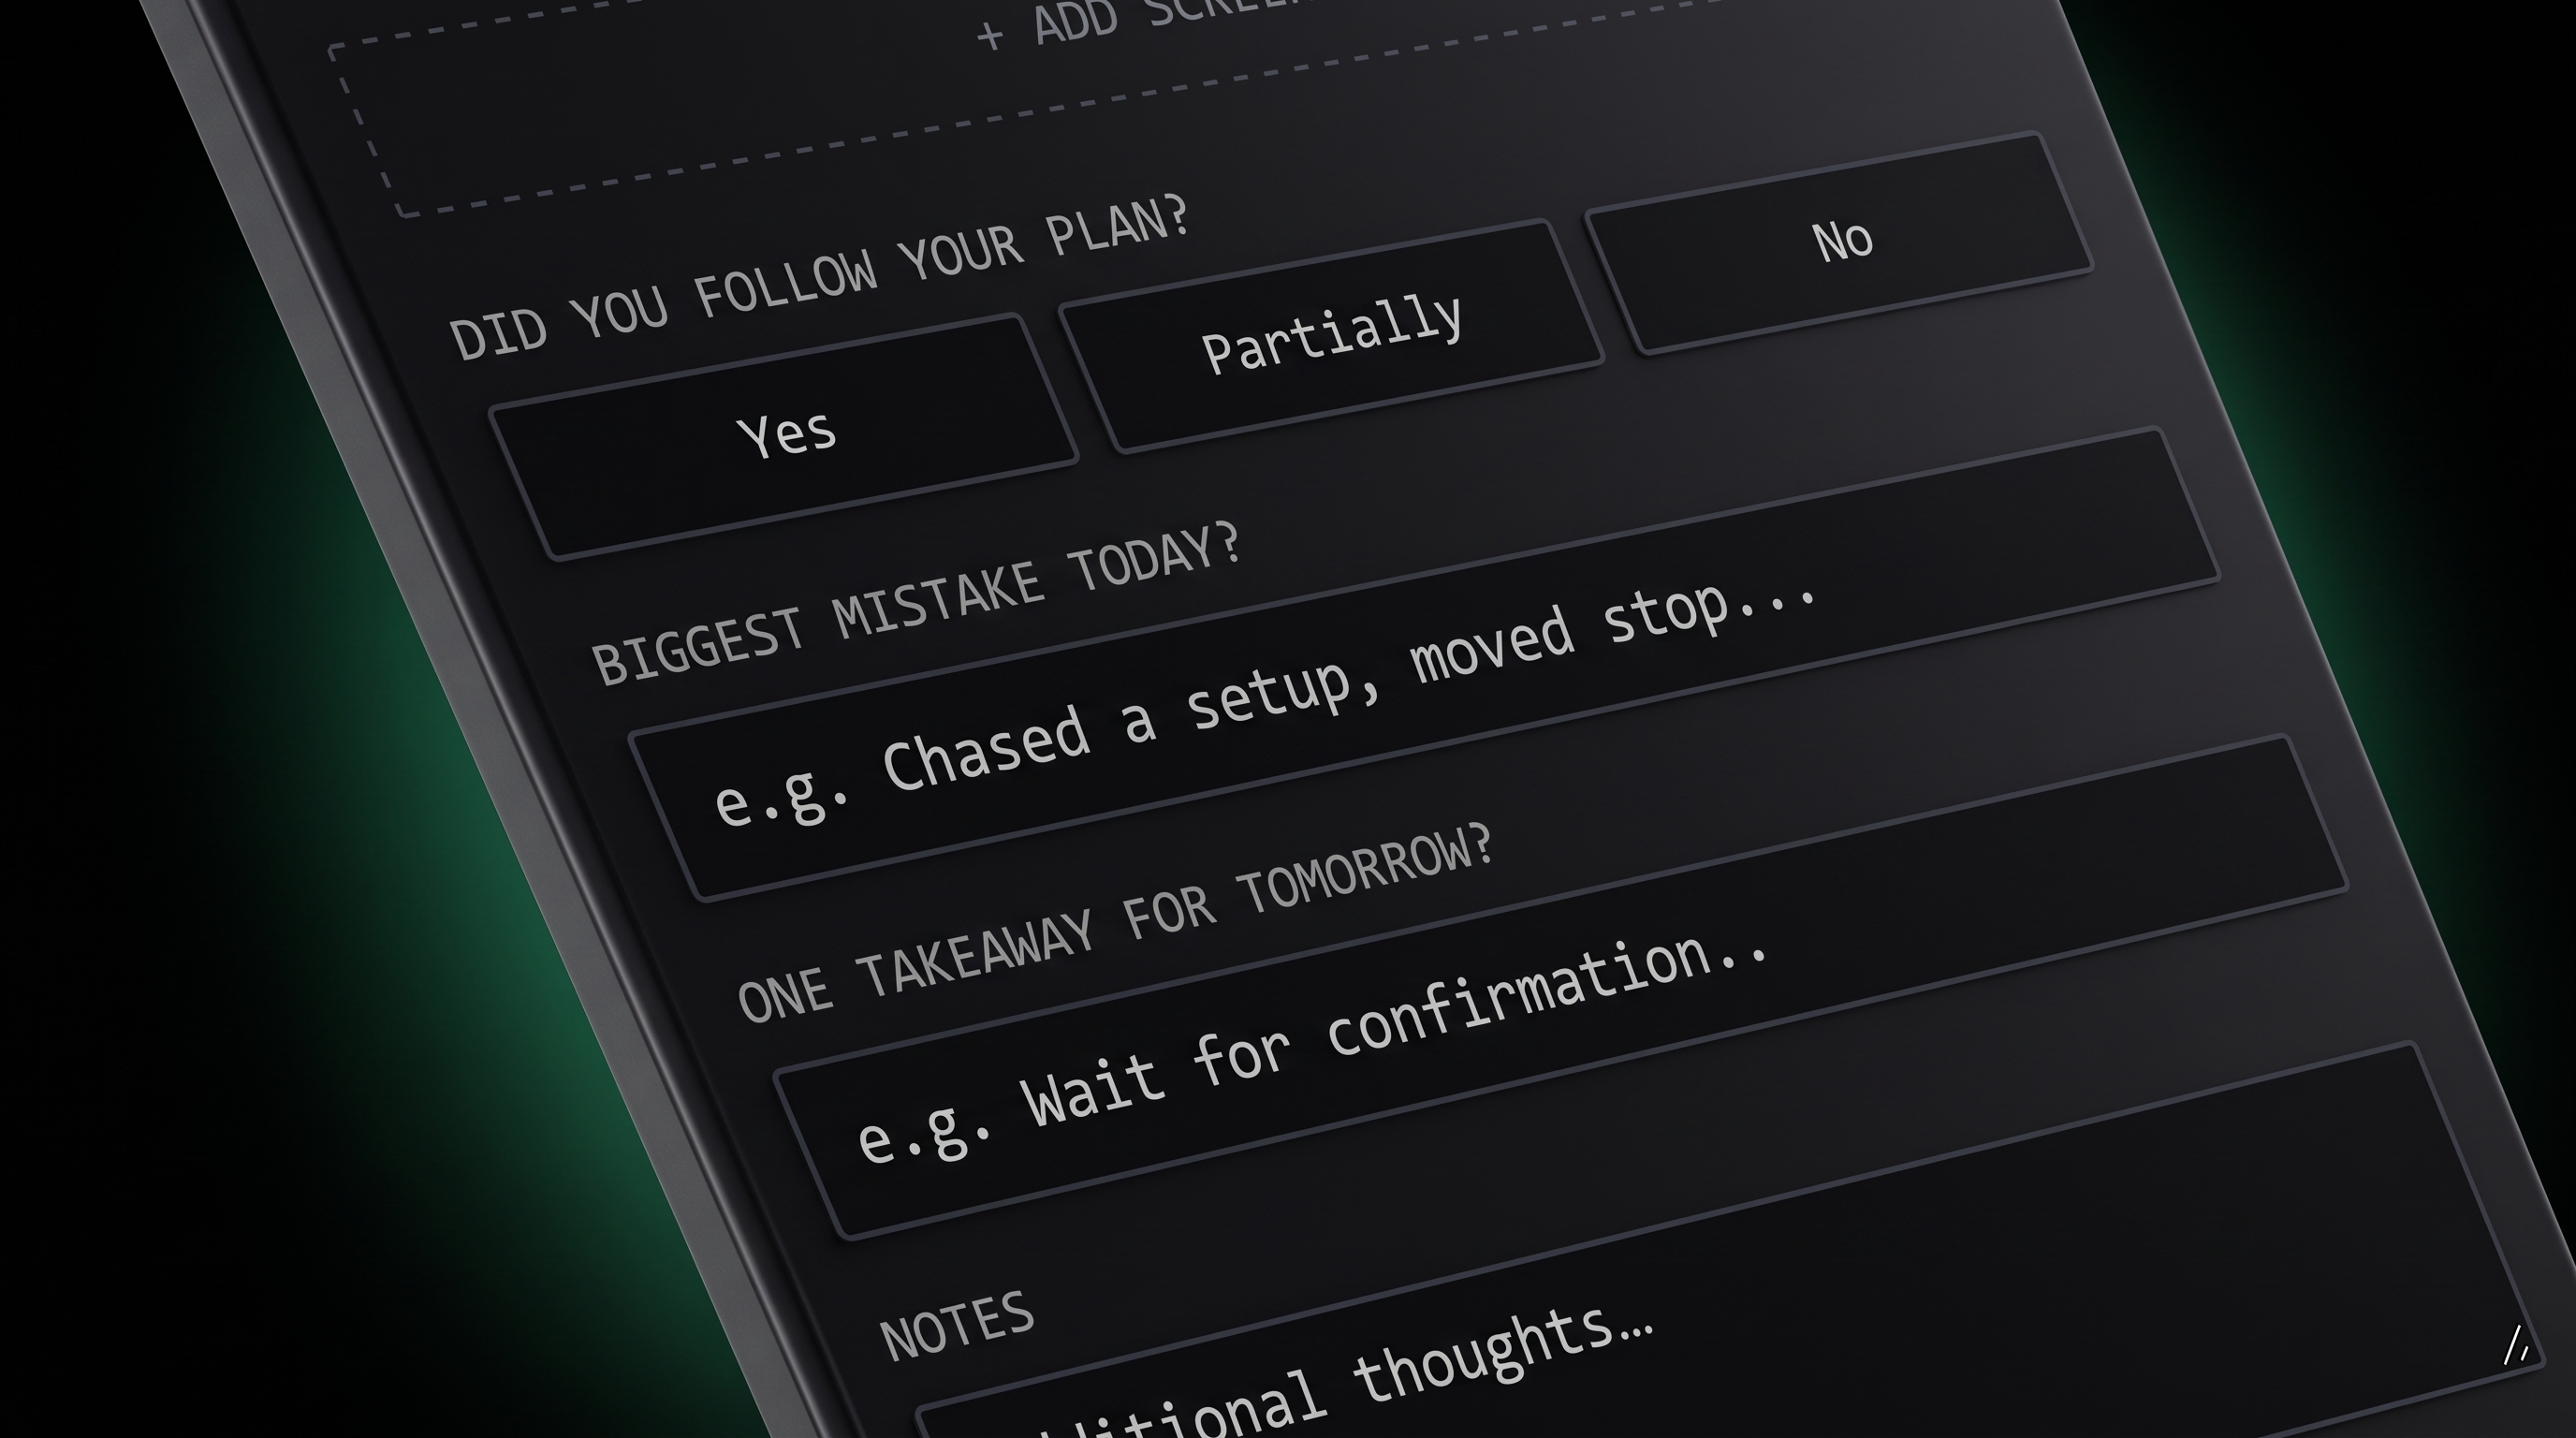
Daily Assessment
Log whether you followed your plan, your biggest mistake, and one takeaway for the day. Tag setups and track daily performance so patterns show up before they cost you.
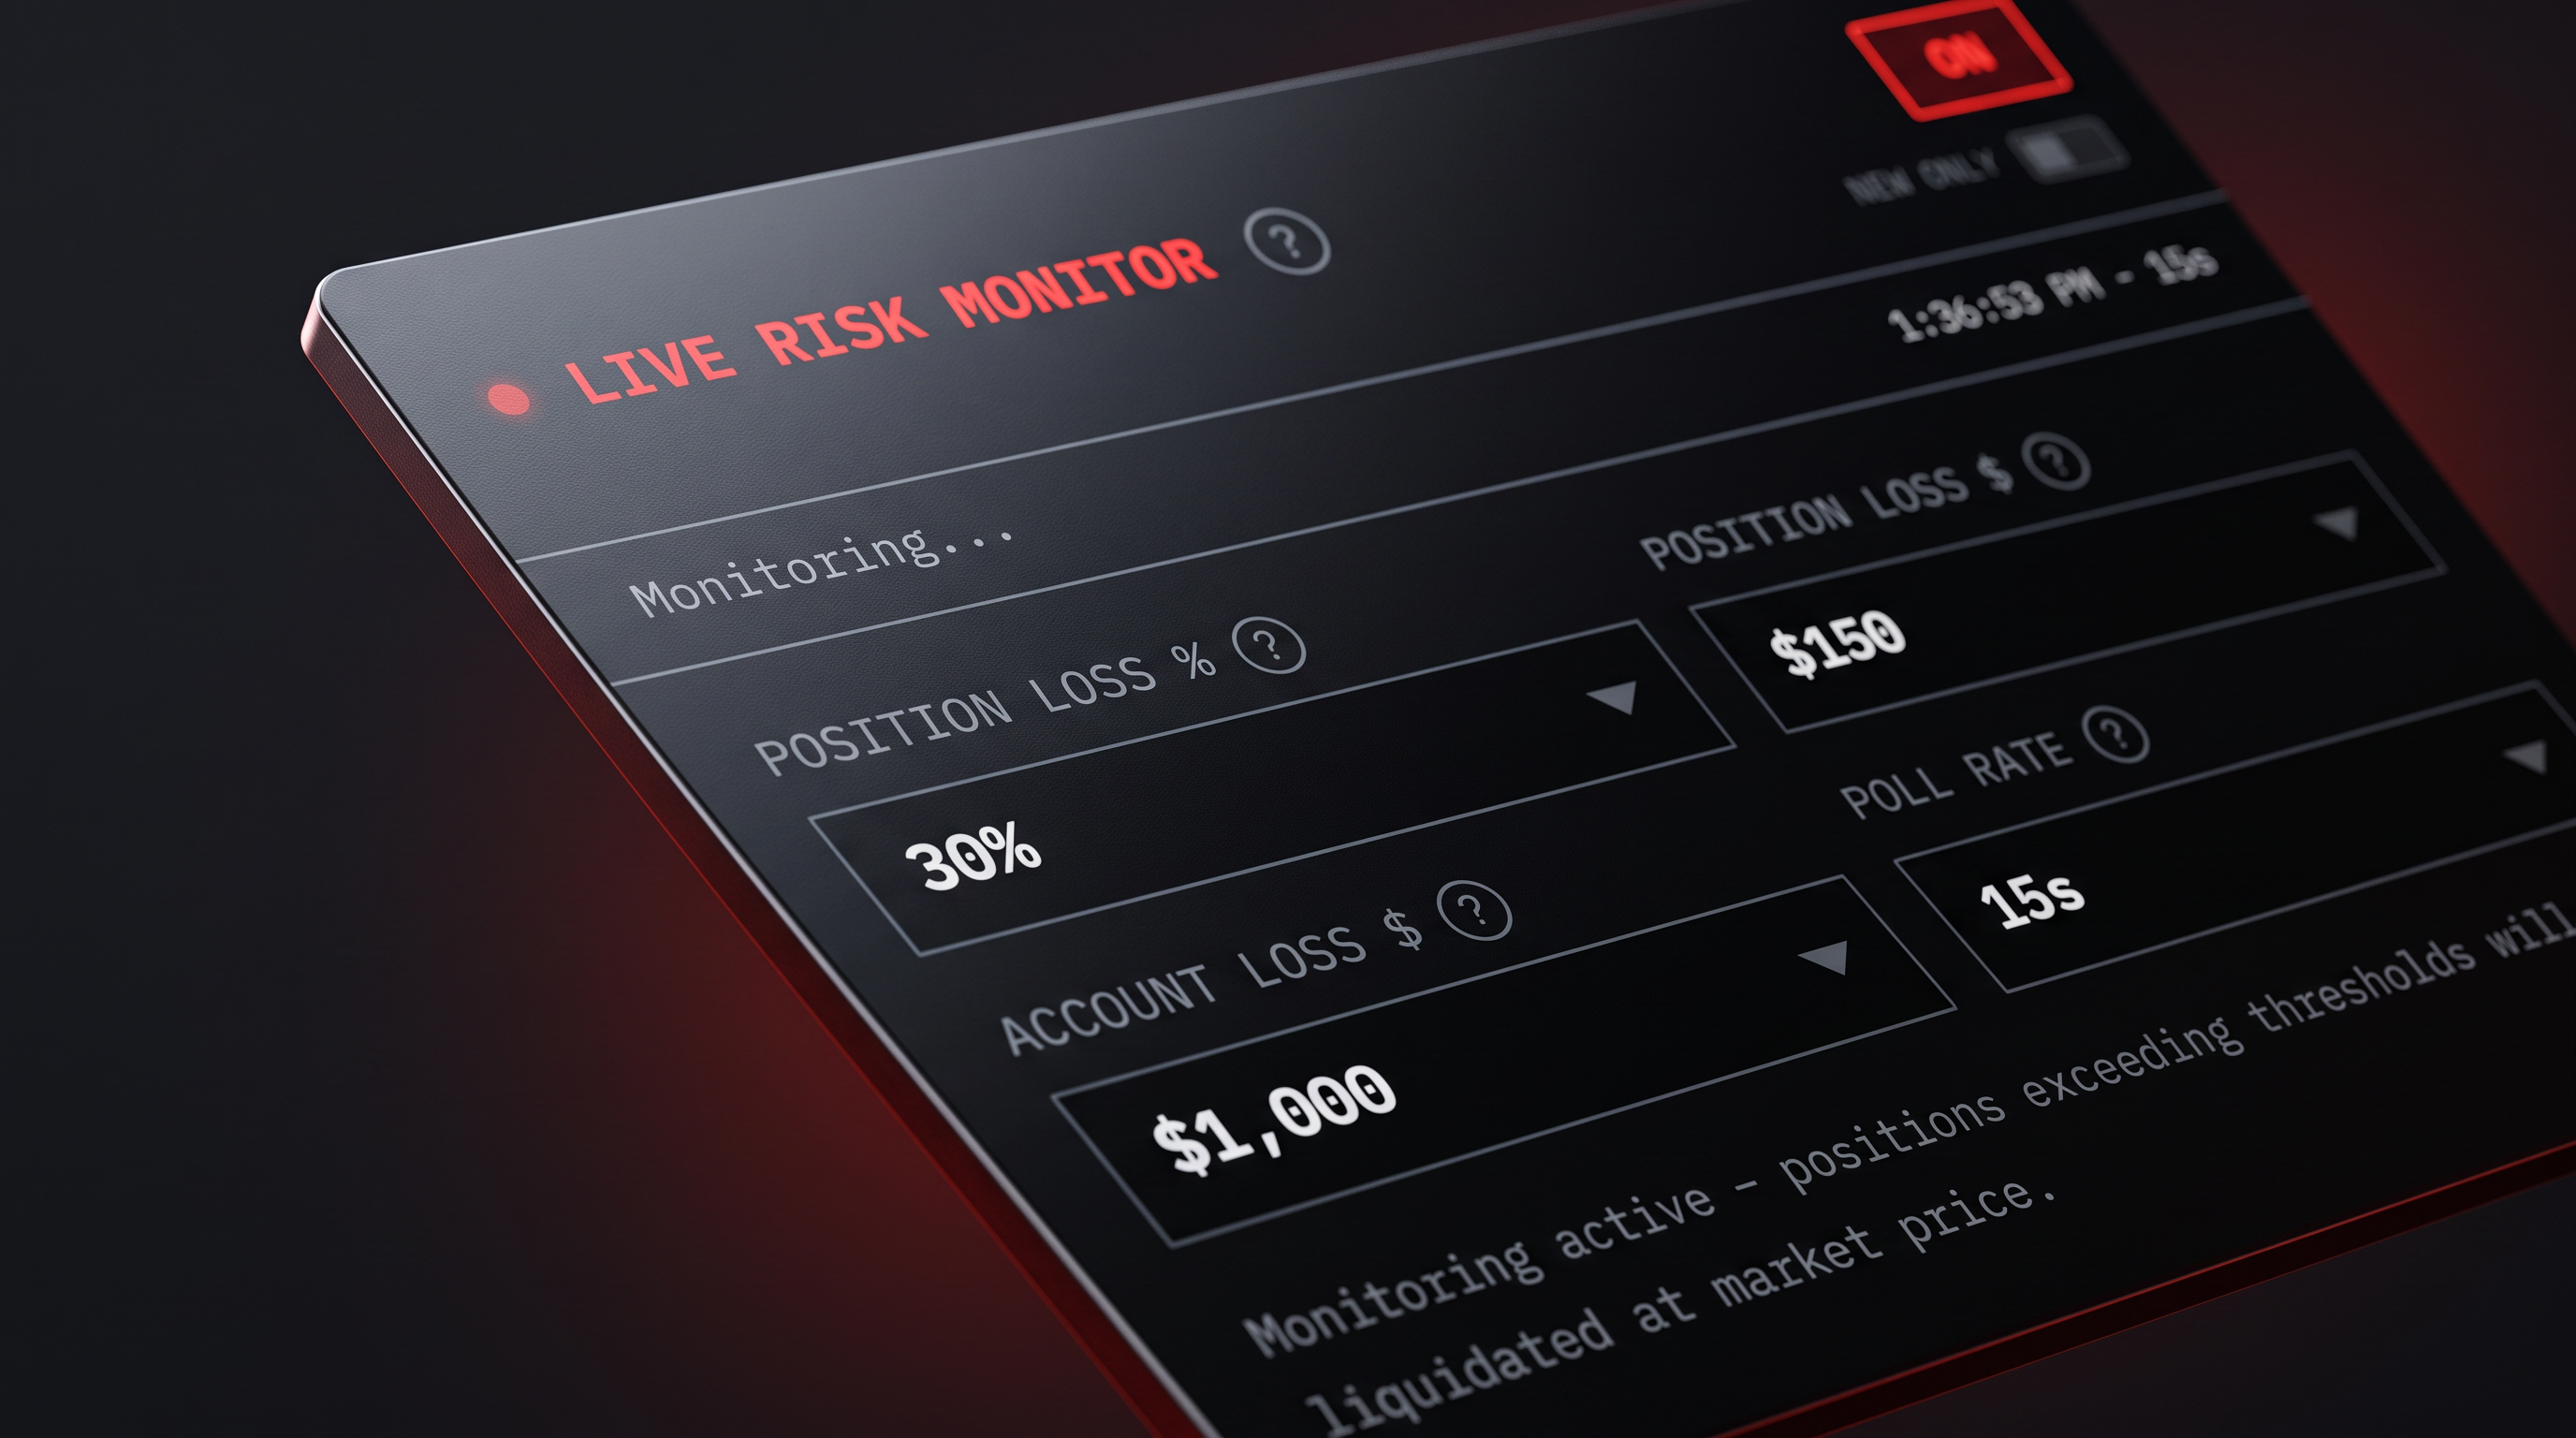
Risk Manager(Schwab only)
Set daily loss limits, max position sizes, and drawdown thresholds. Get alerts before you blow past your rules.
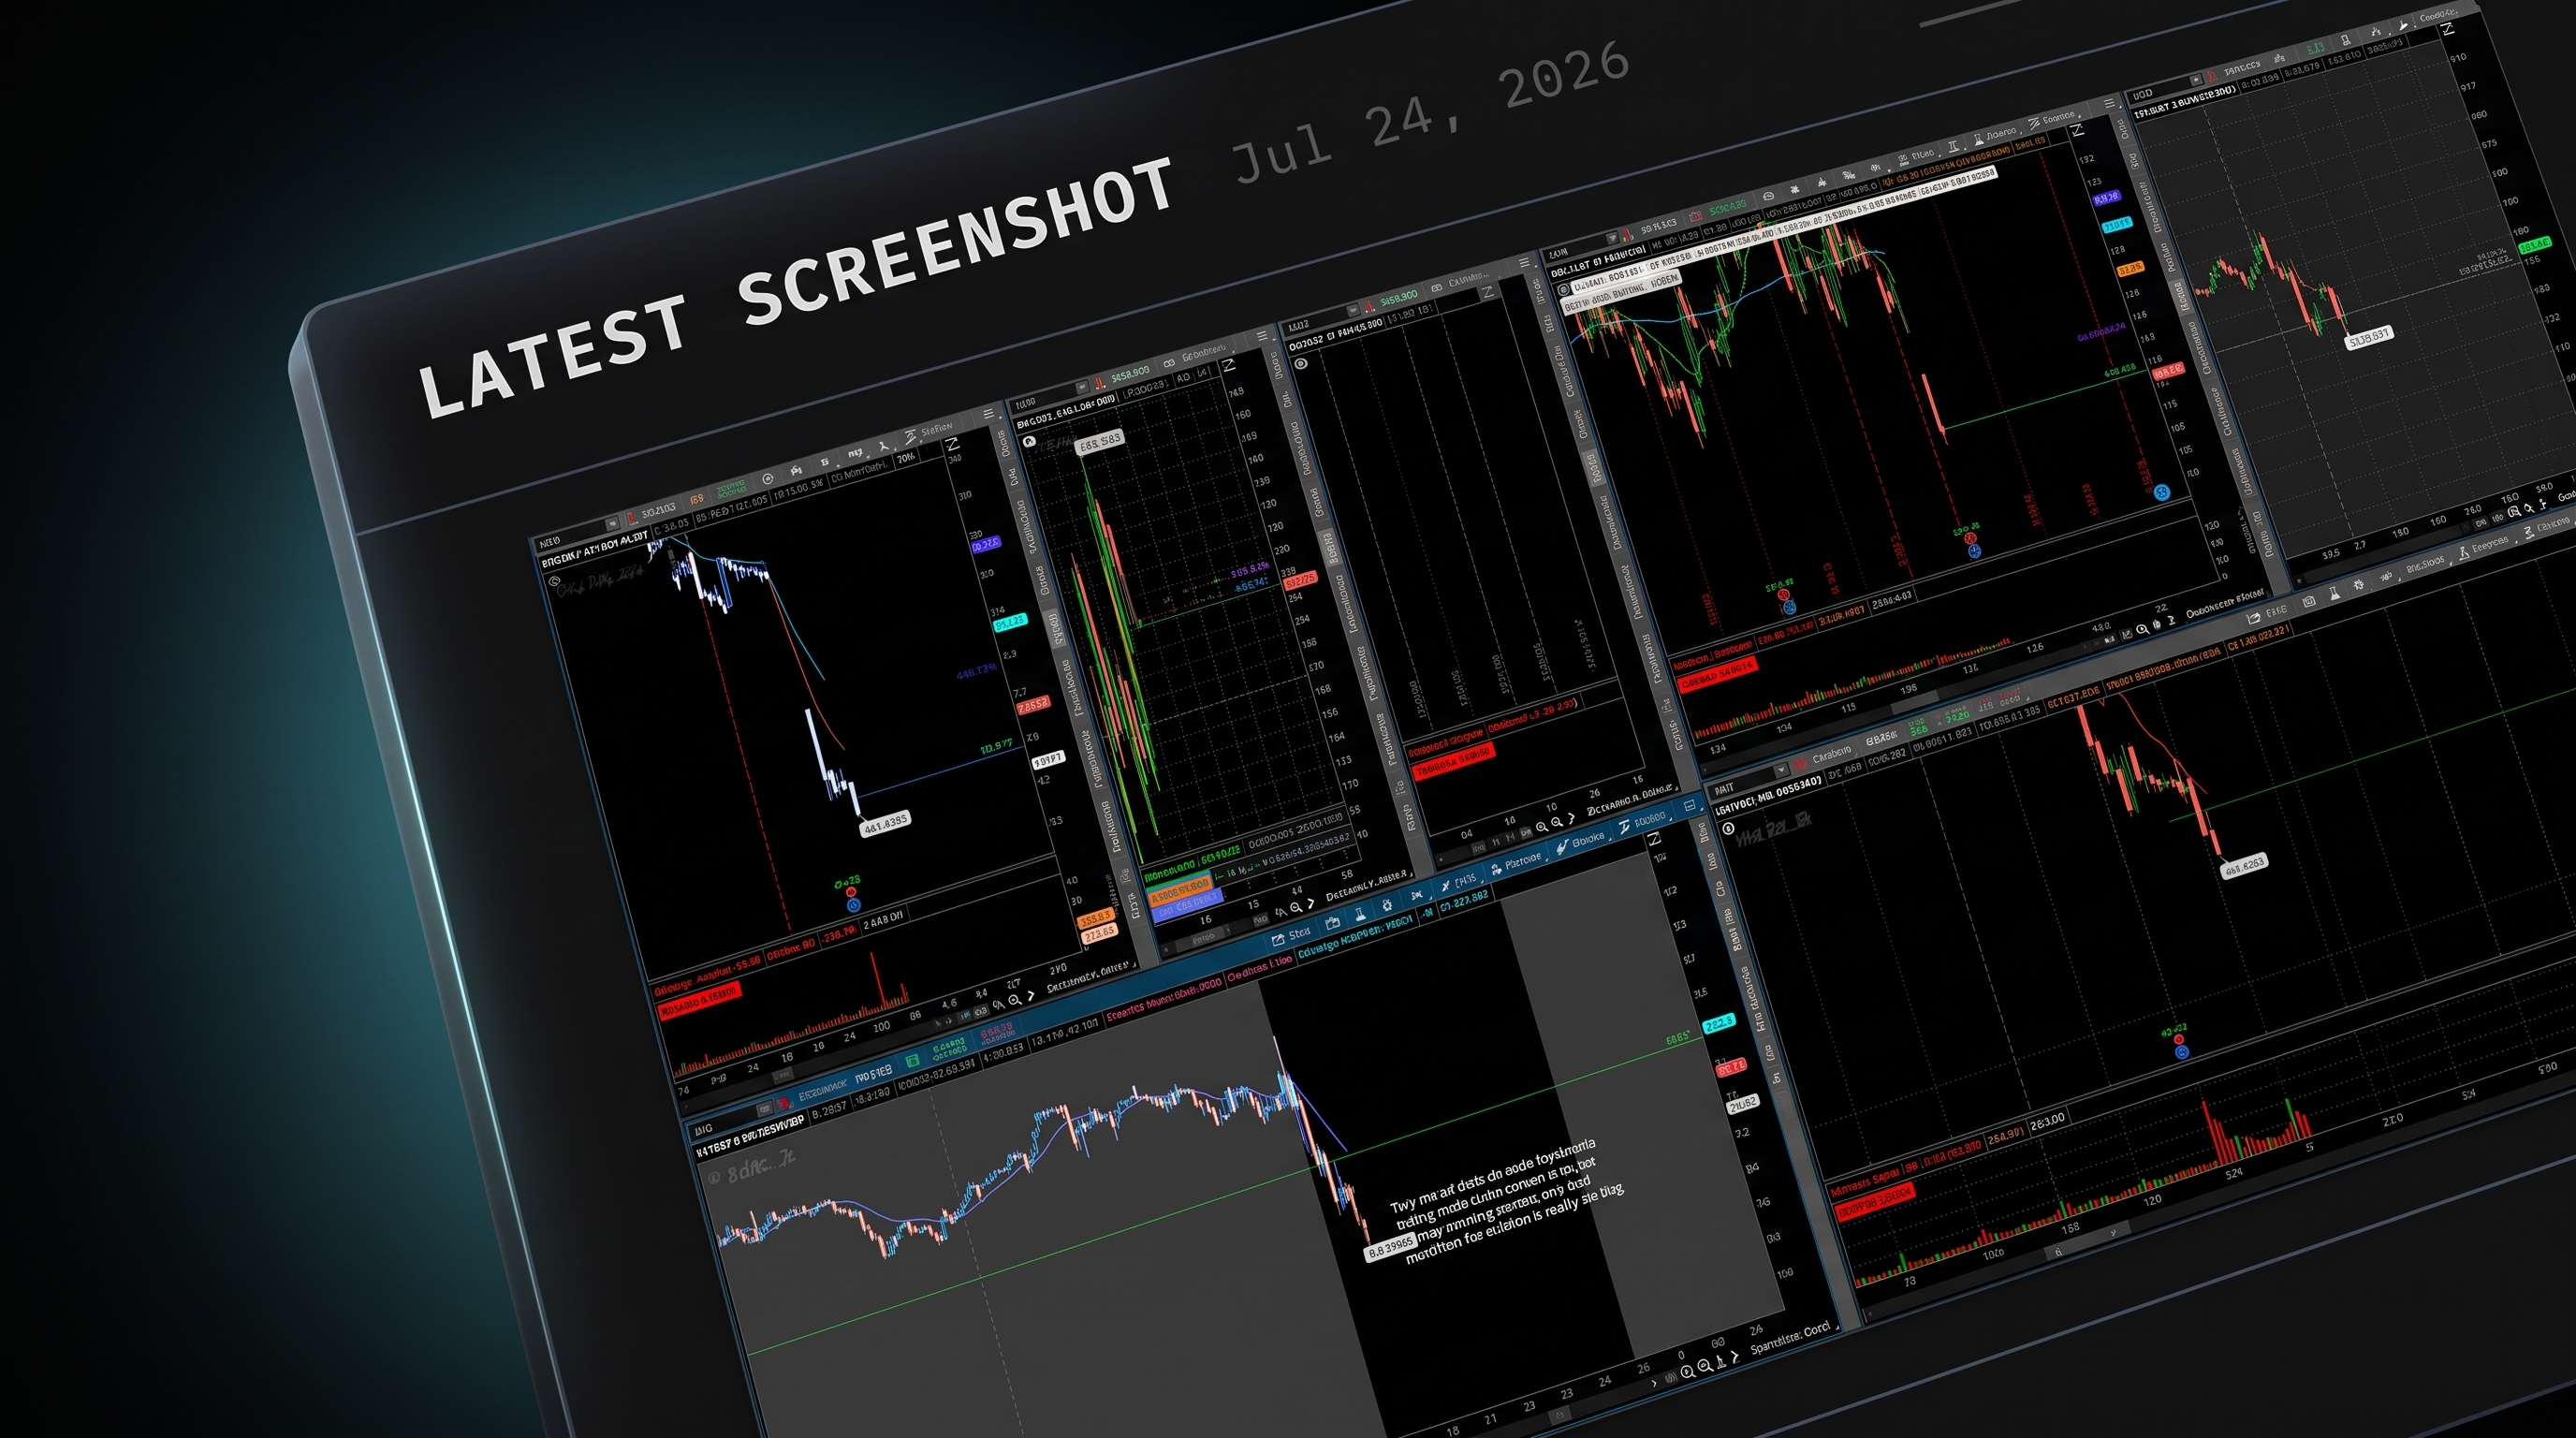
Trade Journal
Attach screenshots, notes, and analysis to every trade. Build a searchable record of your entire trading history with zero friction.
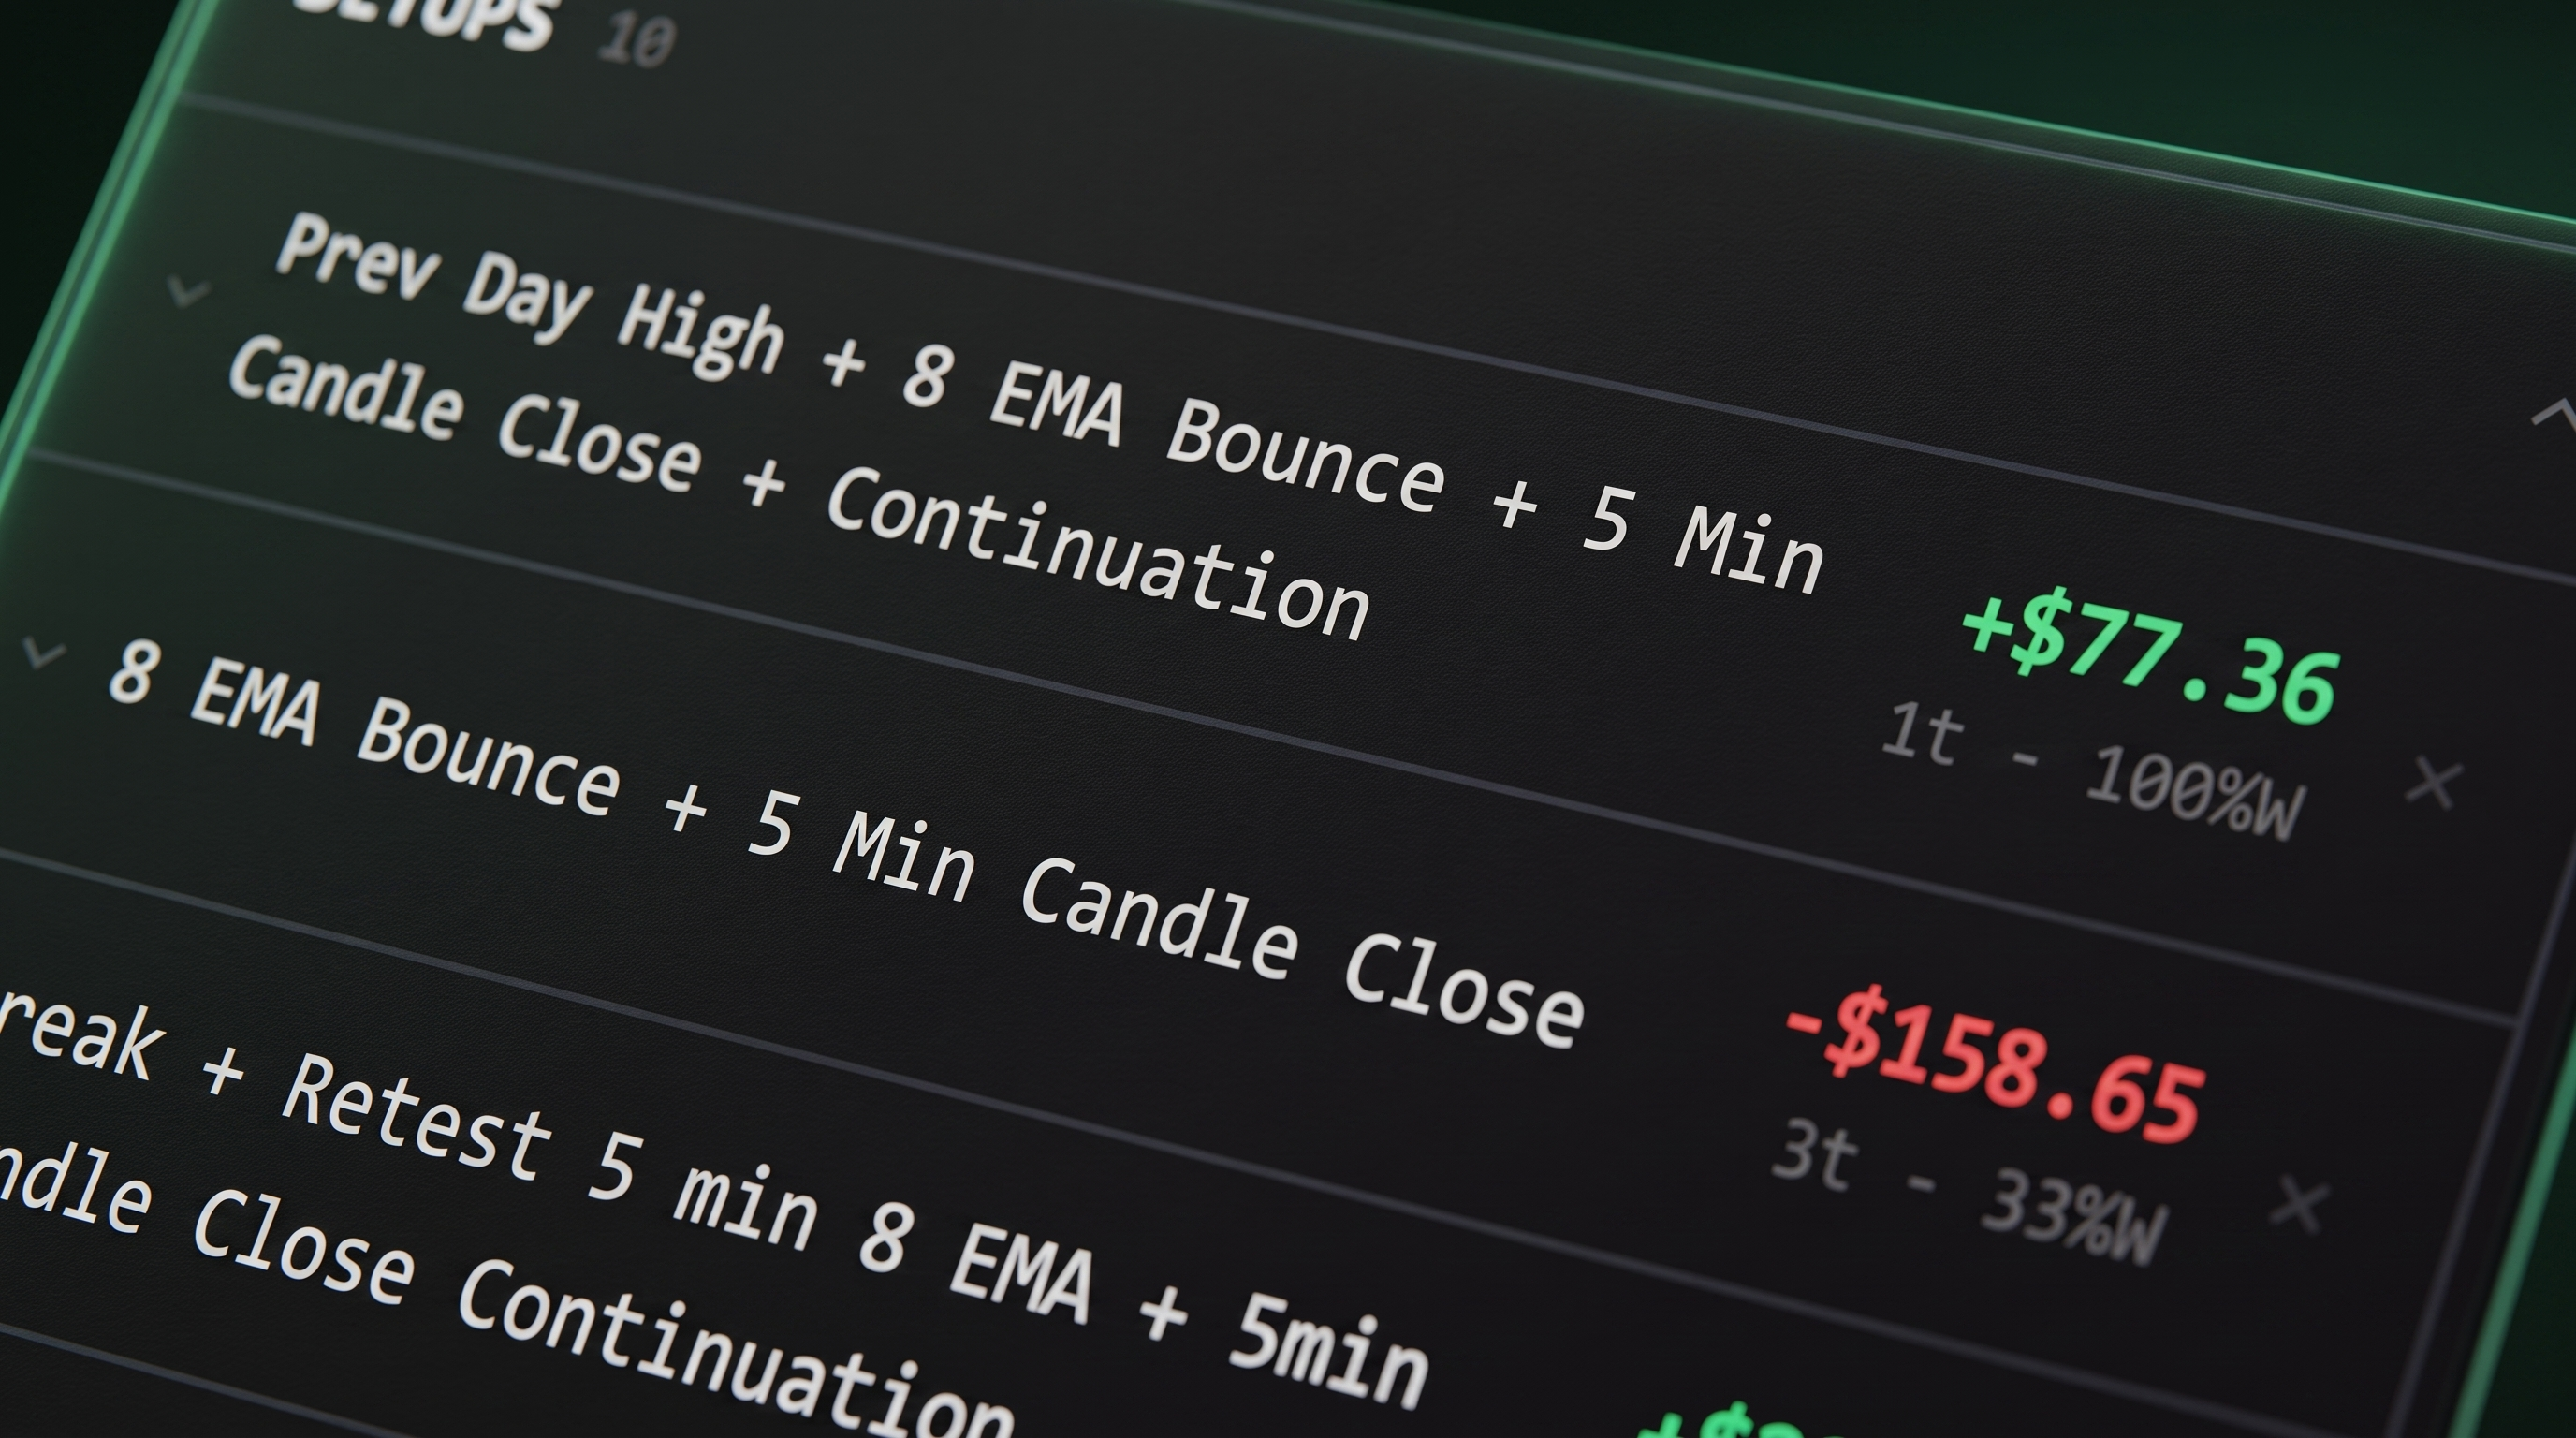
Setup Tracking
Log your trading setups and track win rate and average P/L for each one. See exactly which setups are actually working and which ones are quietly costing you money.
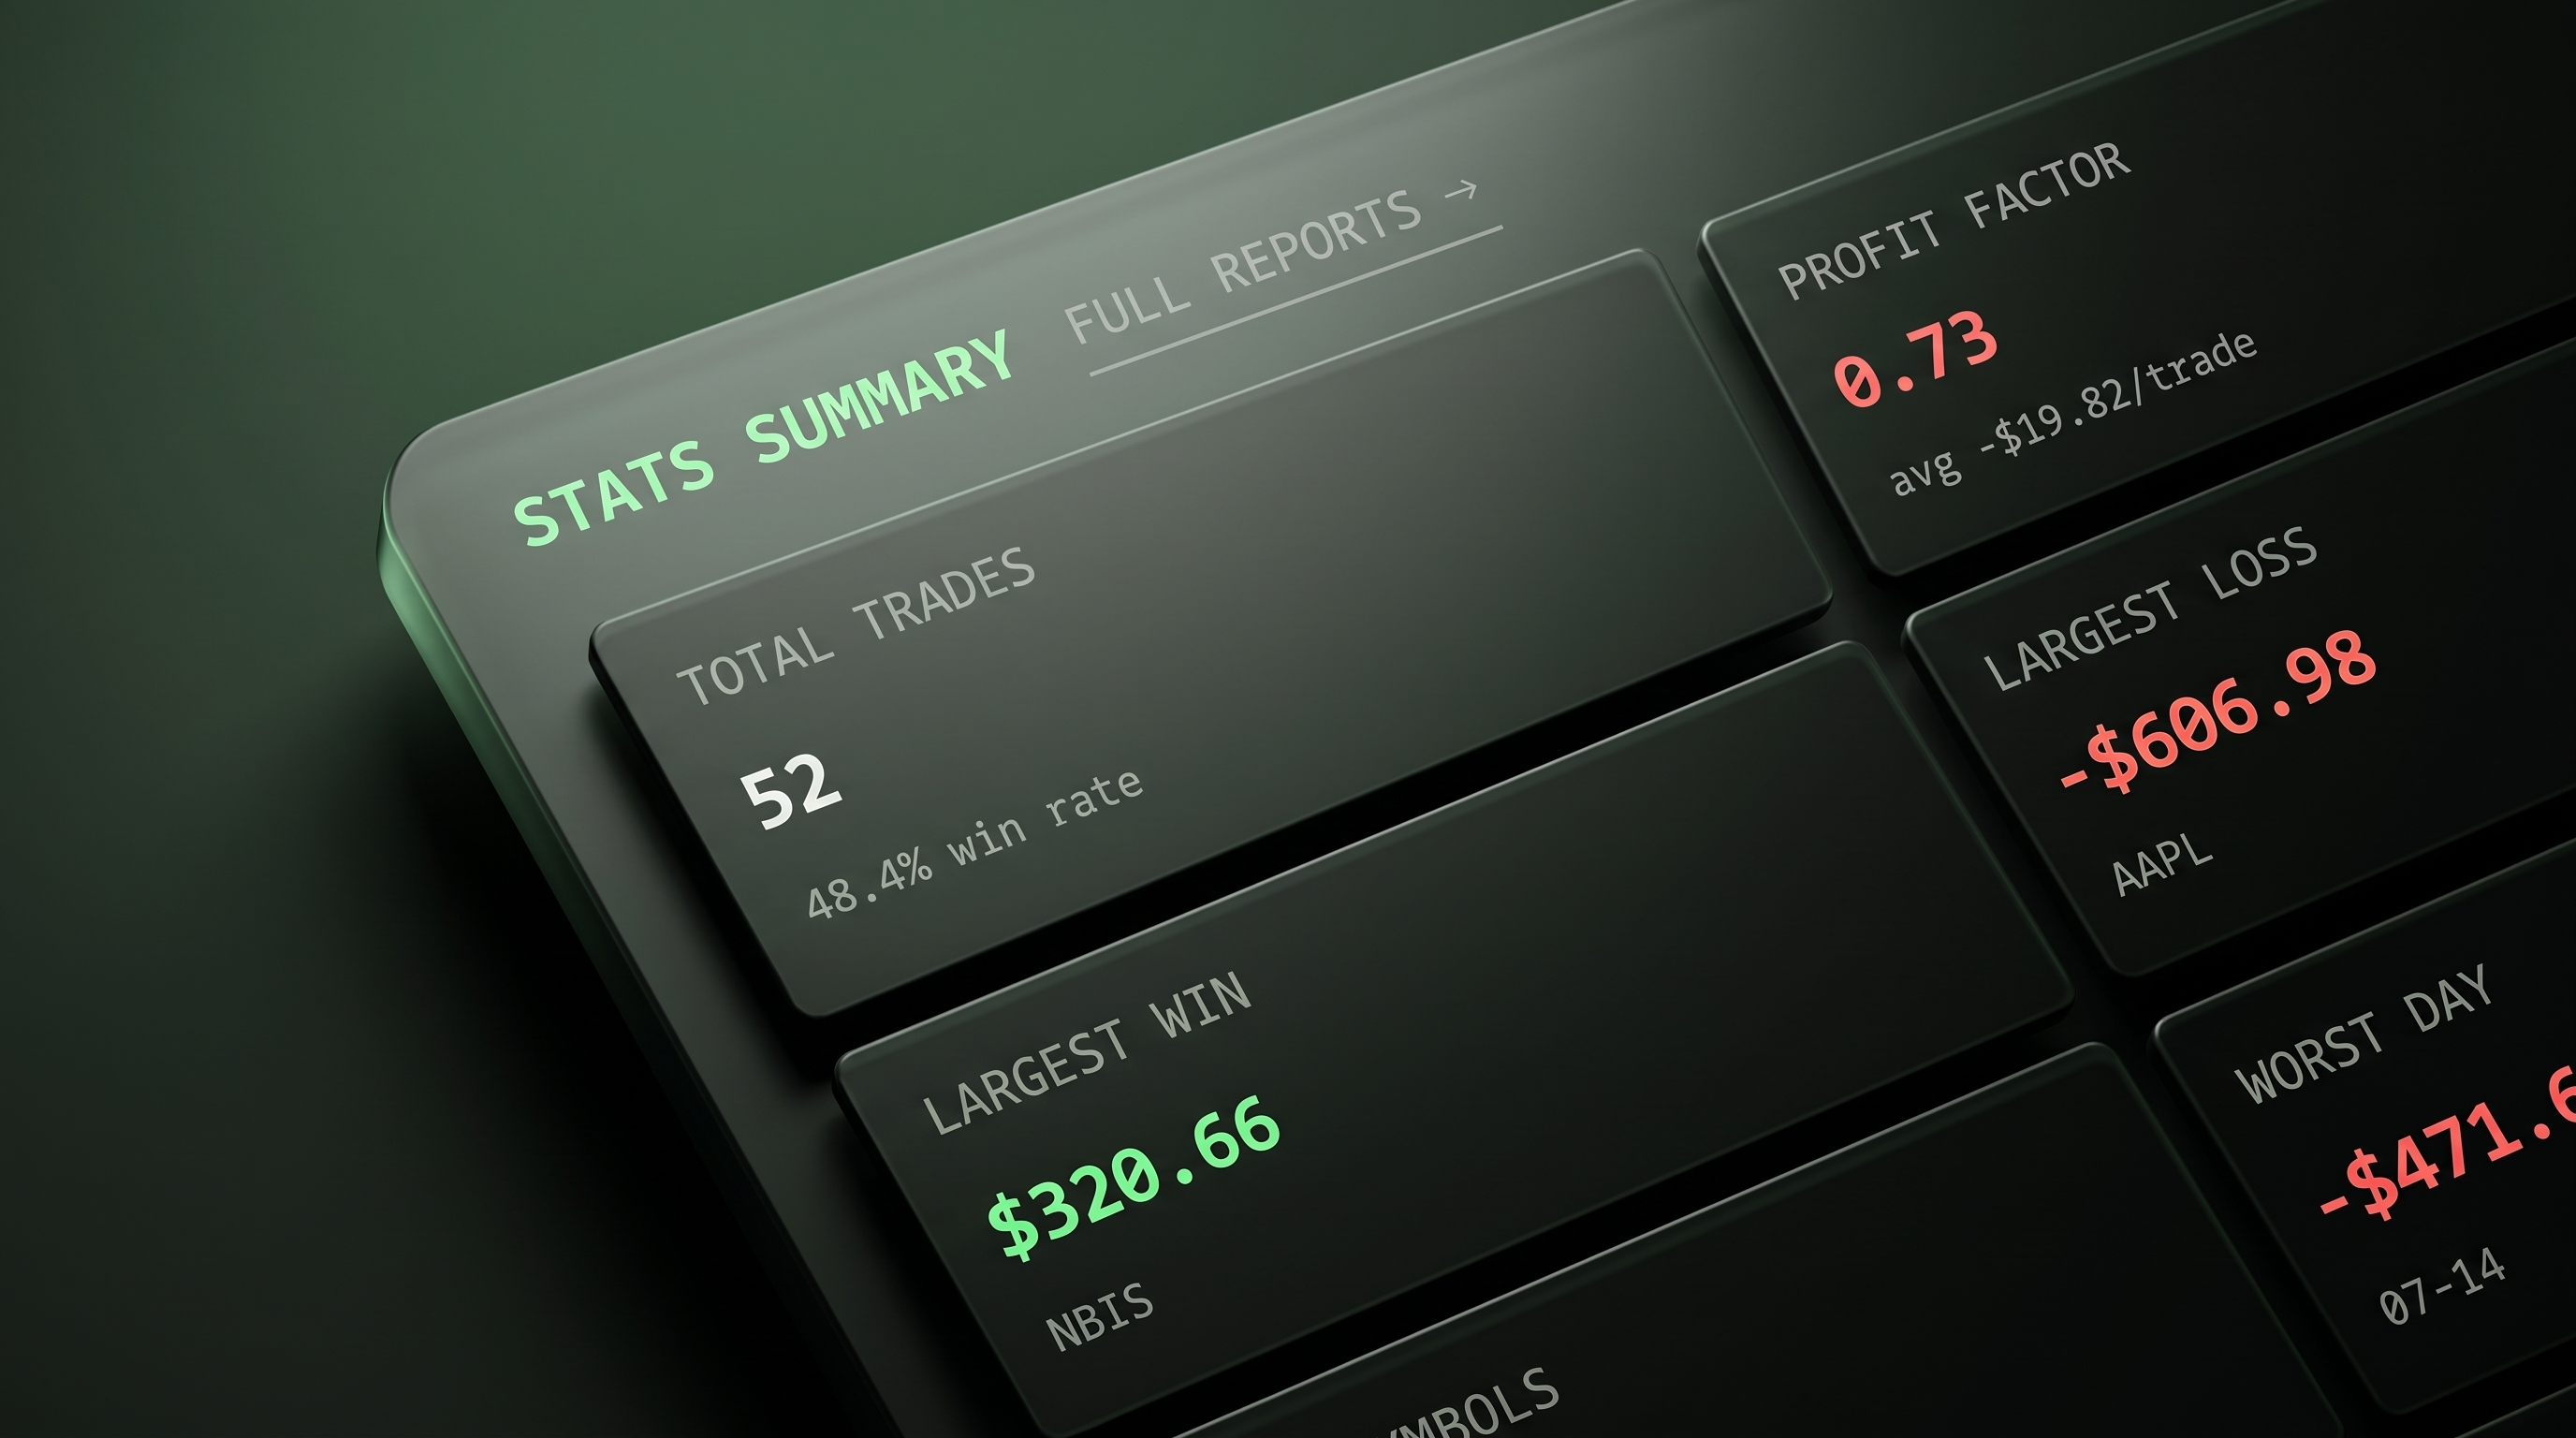
Advanced Stats
Profit factor, largest win and loss, best and worst day, top and bottom symbols, and historical risk metrics — every number you need to evaluate your edge, in one place.
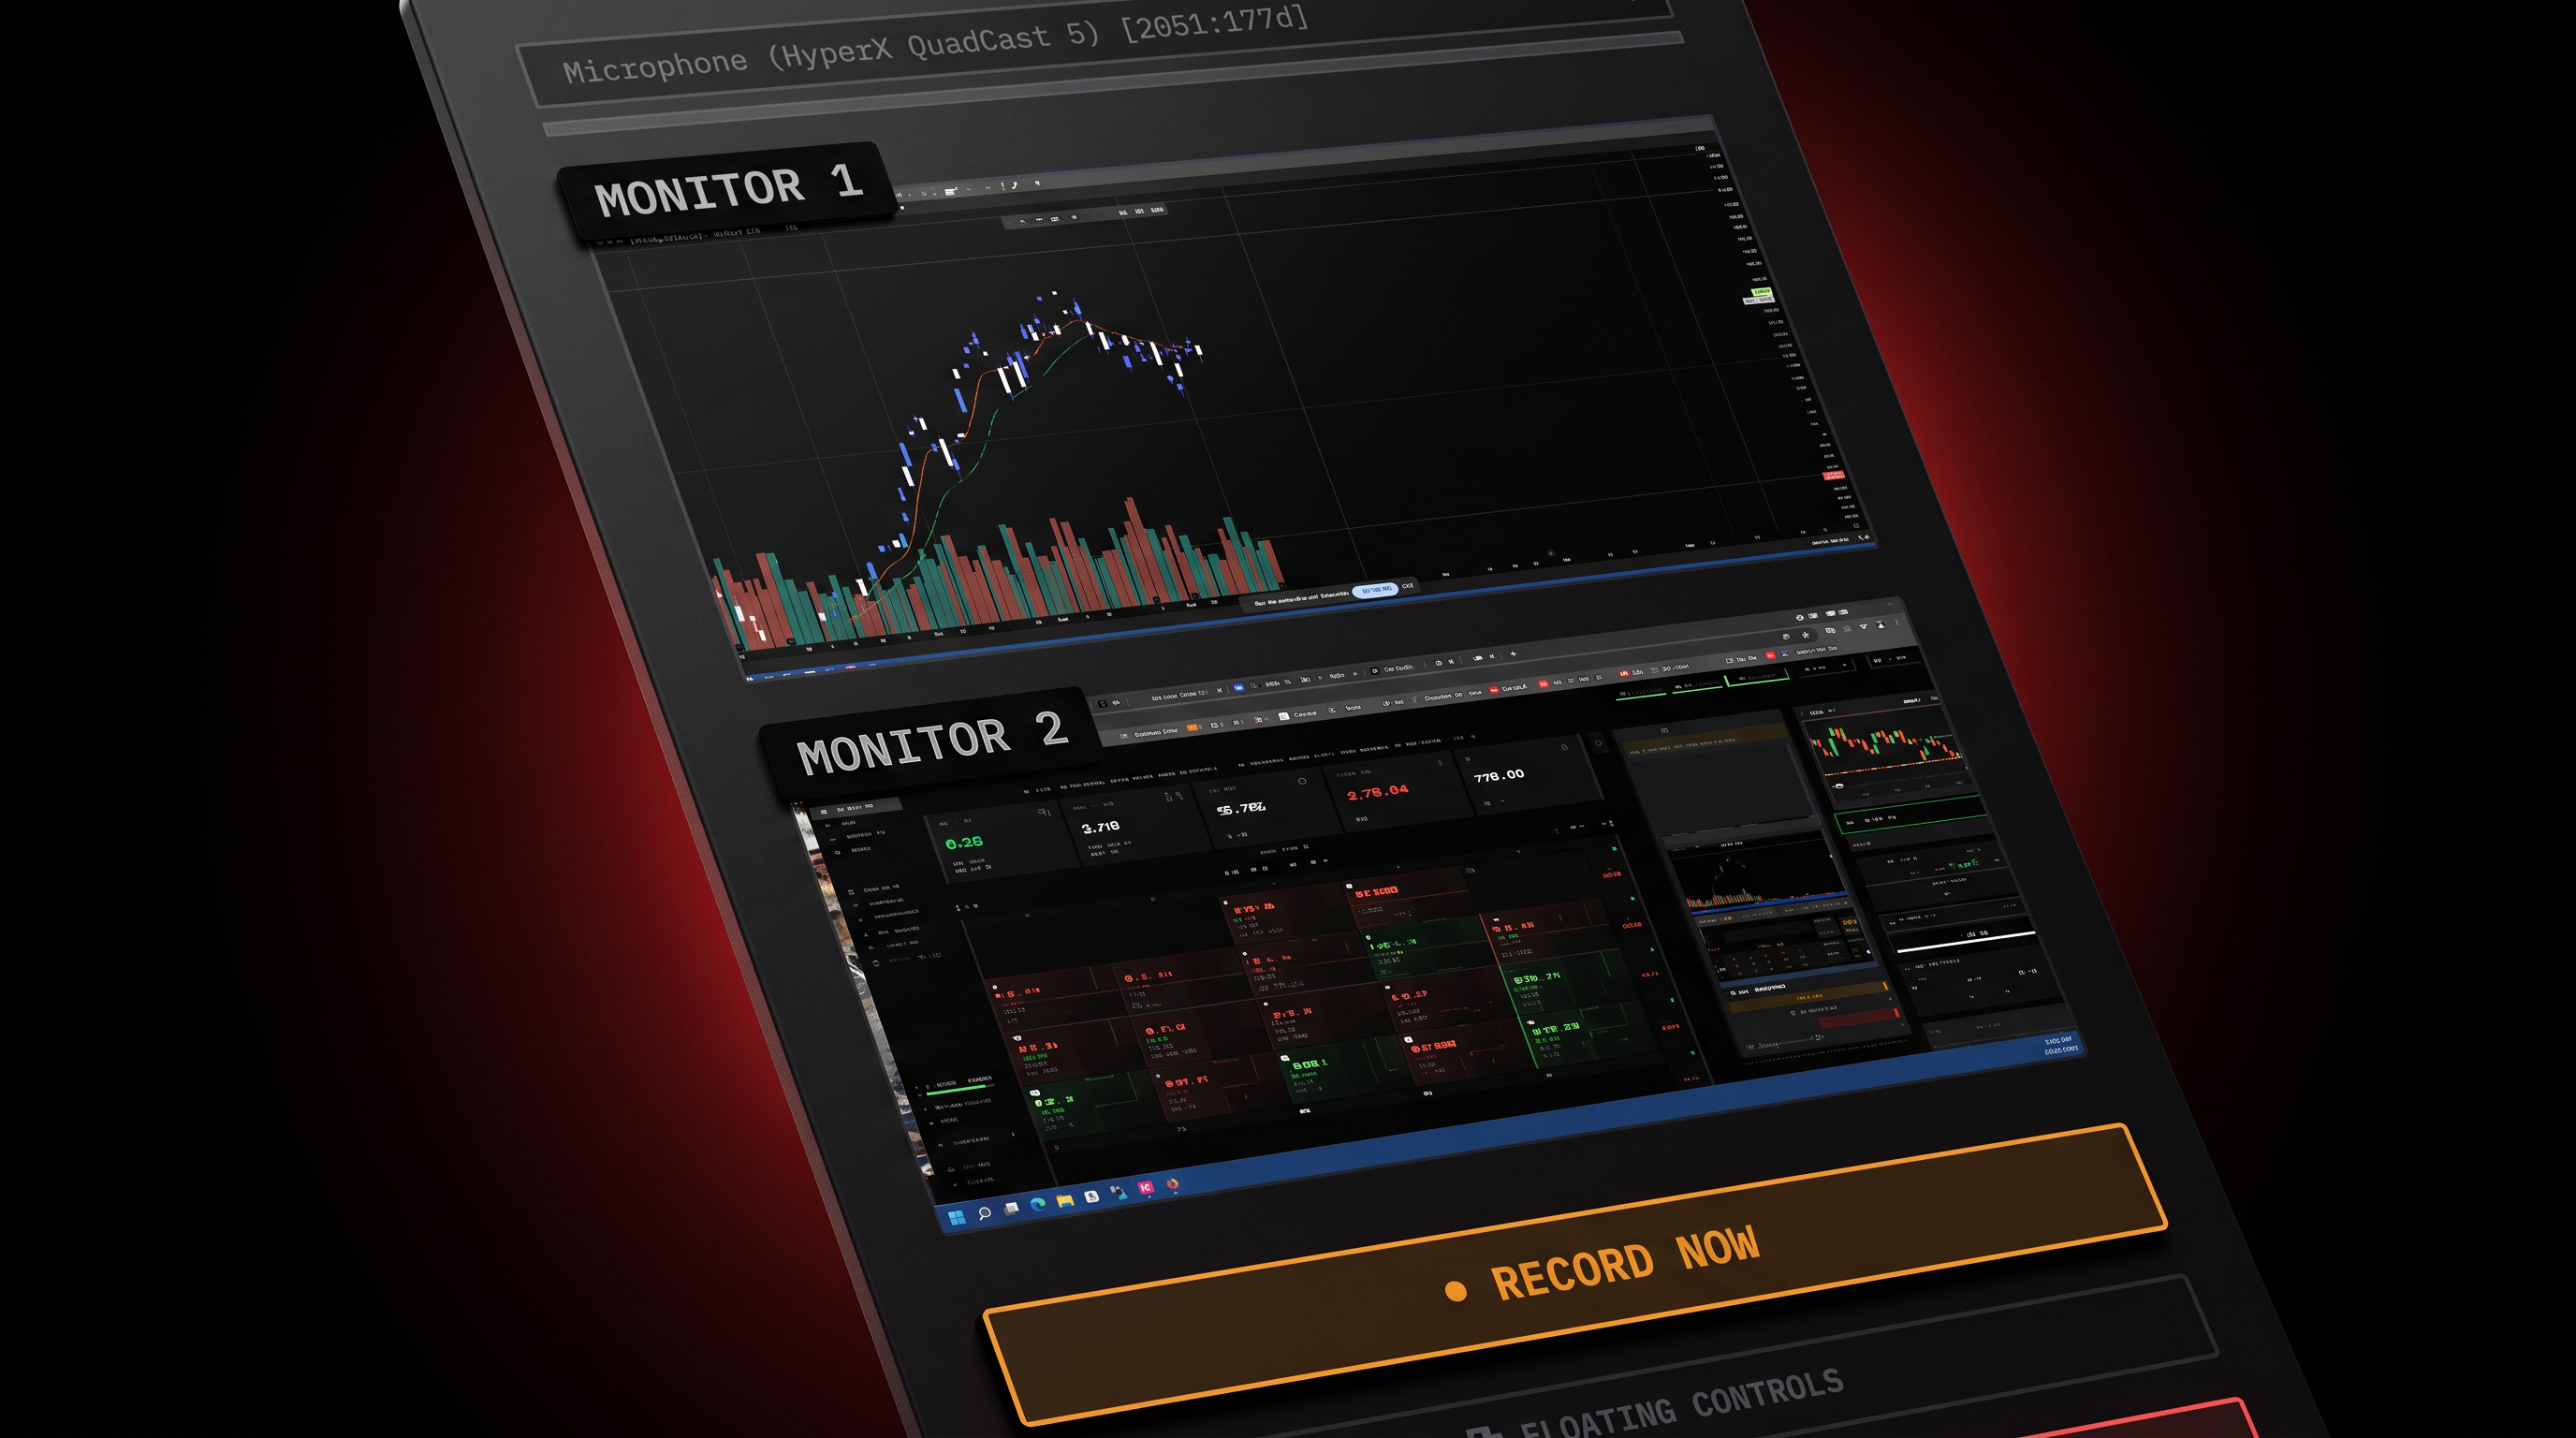
Trade Cam
Automatically record your screen and face cam around every trade. Review exactly what you saw and did in the moment, not just what the chart looked like after the fact.
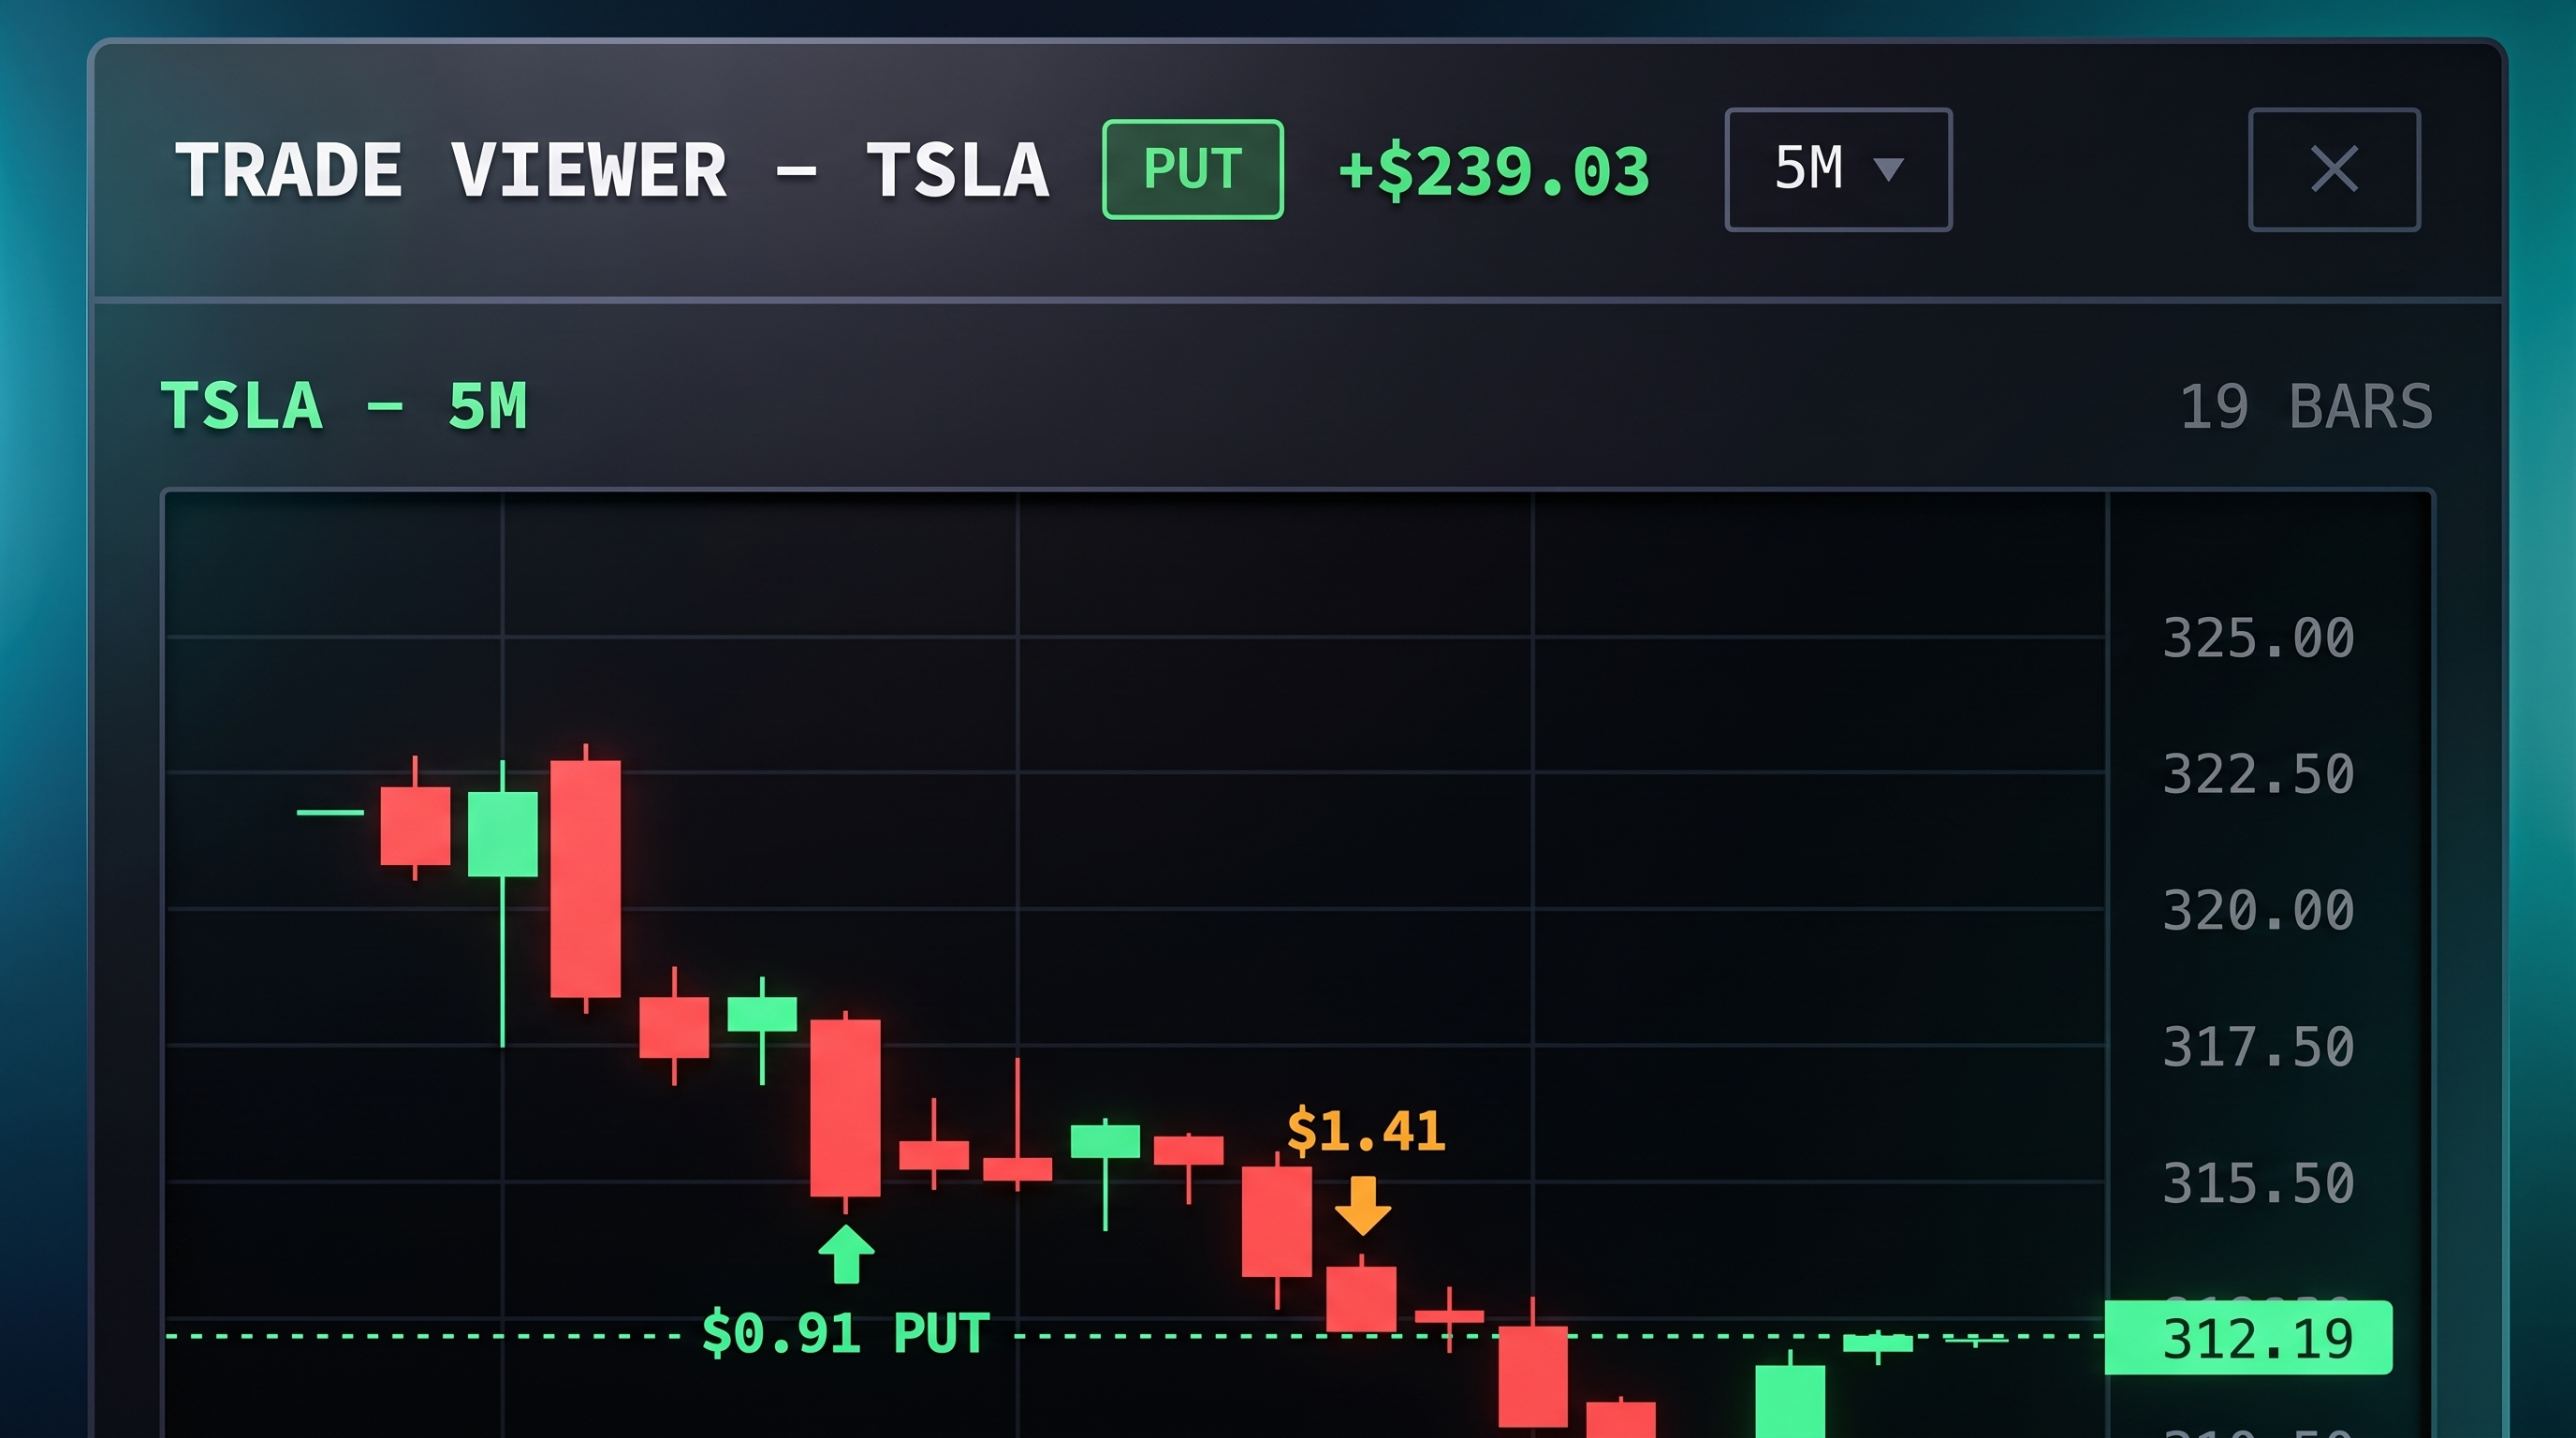
Trade Viewer
Replay any trade on its actual candlestick chart with entry, exit, and live P/L marked. See precisely where you got in and out relative to the price action.
And there's more
More Ways to Find Your Edge
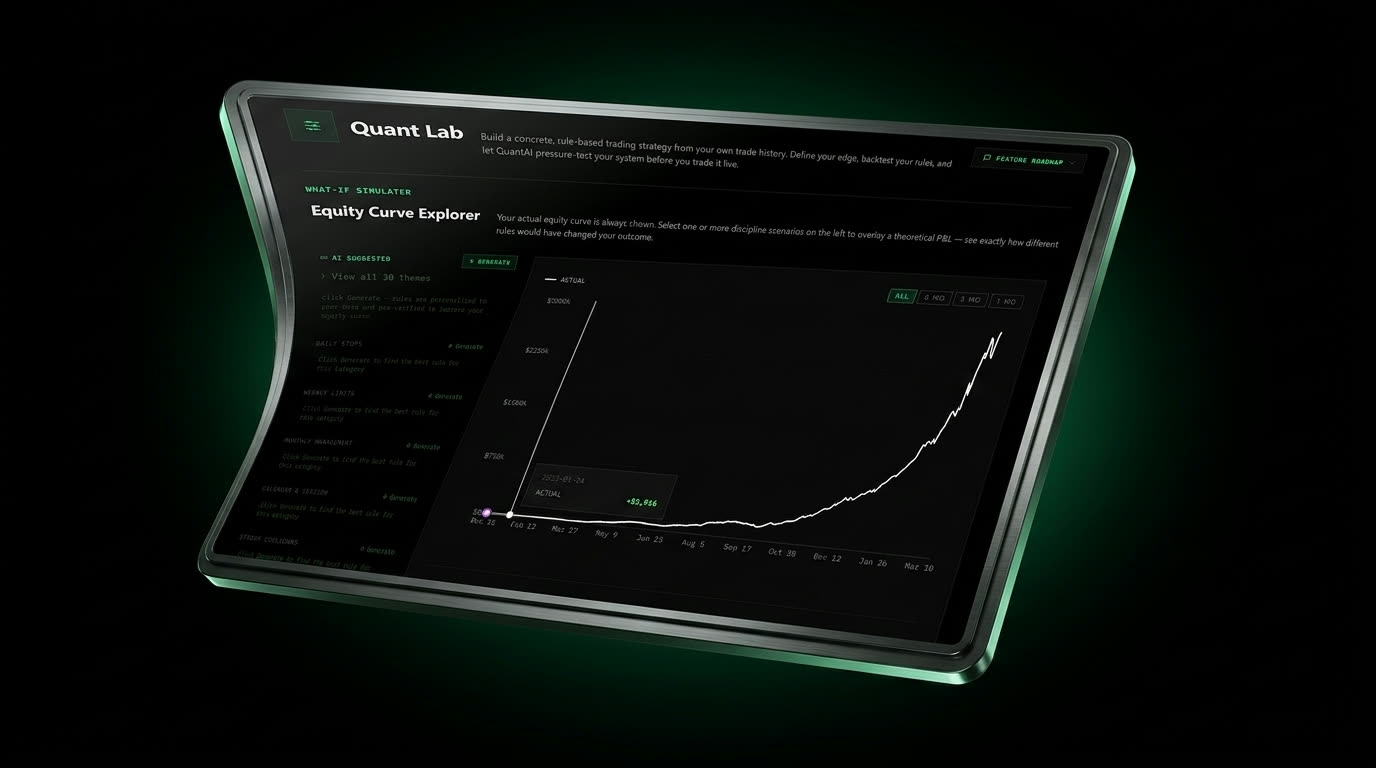
Quant Lab
Build a concrete, rule-based trading strategy from your own trade history. Backtest discipline scenarios and pressure-test your system with AI before you trade it live.
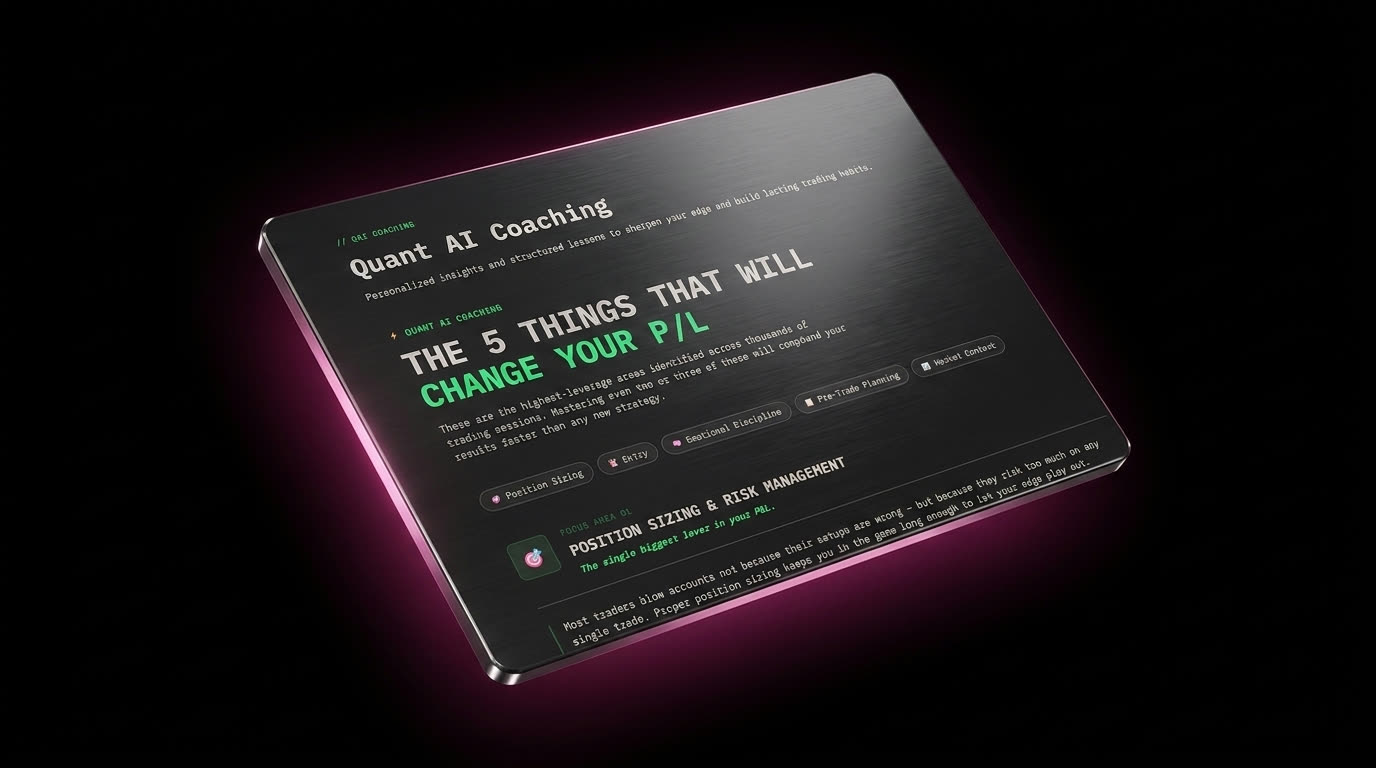
Quant AI Coaching
The highest-leverage areas identified across thousands of trading sessions, mapped to your own P&L — personalized lessons, not generic trading advice.
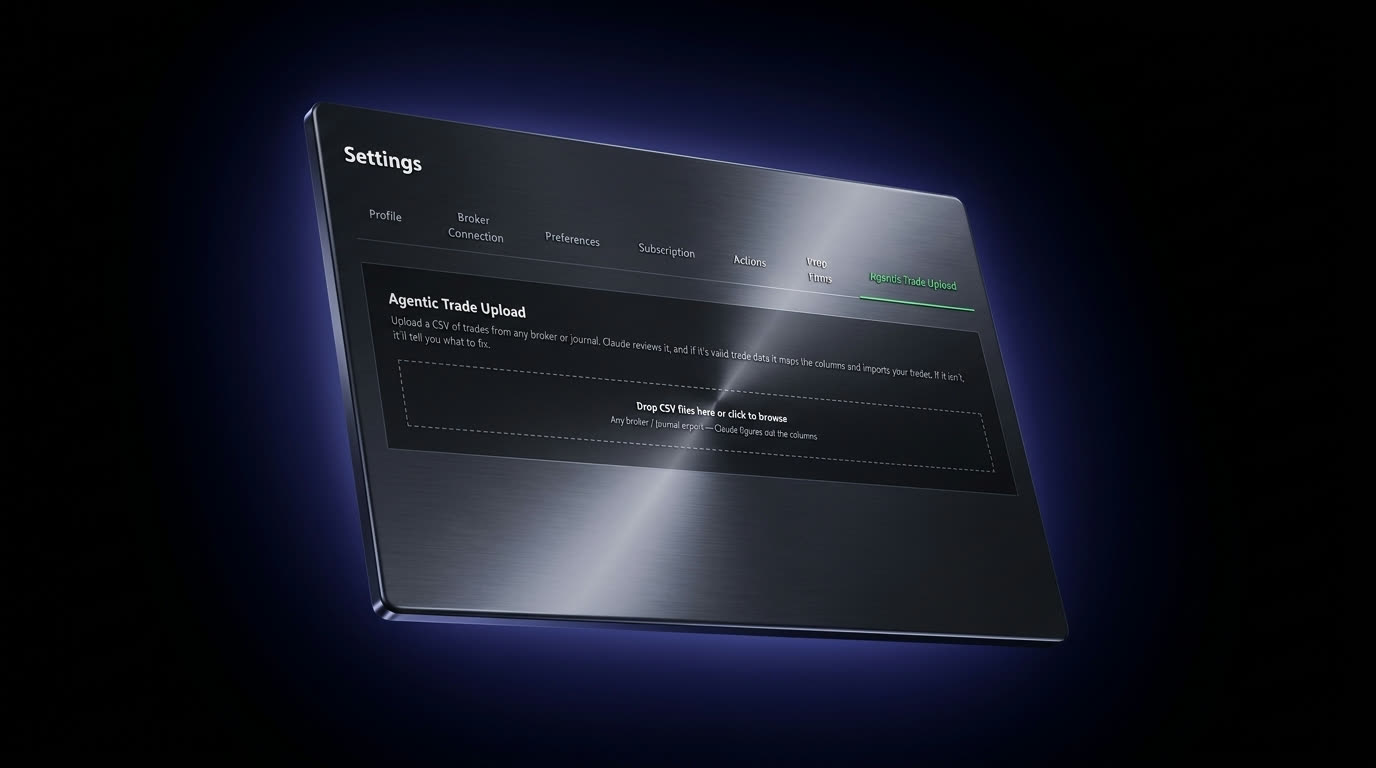
Multi-Broker & Prop Firm Import
Upload a CSV from any broker or prop firm — Apex, Topstep, and more. Claude reads the columns, maps them, and imports your trades automatically.
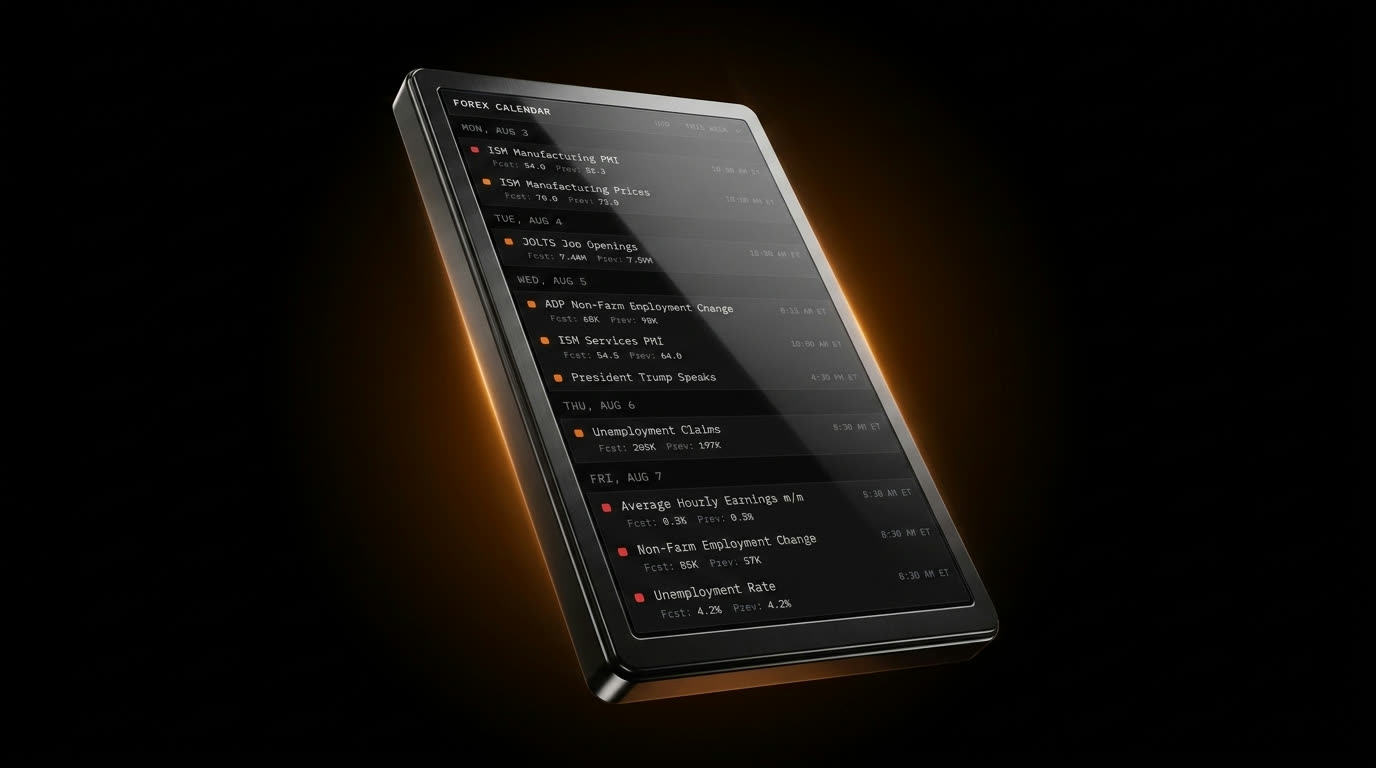
Economic Calendar
Every high-impact macro event for the week — CPI, NFP, Fed speakers — with forecast vs. prior, so you know what's about to move the market before it happens.
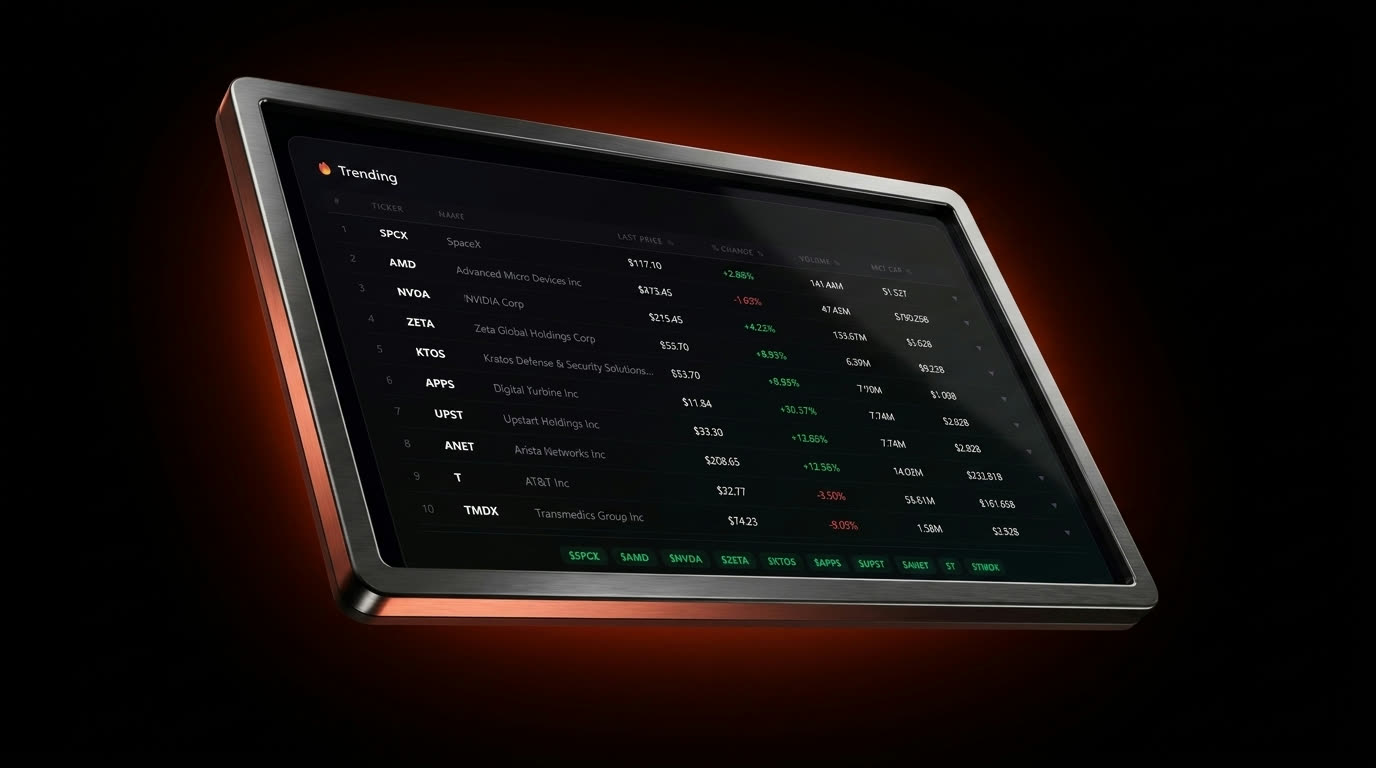
Trending Movers
Real-time top gainers, losers, and most-active tickers pulled live from the market — spot the names everyone's trading before they're old news.
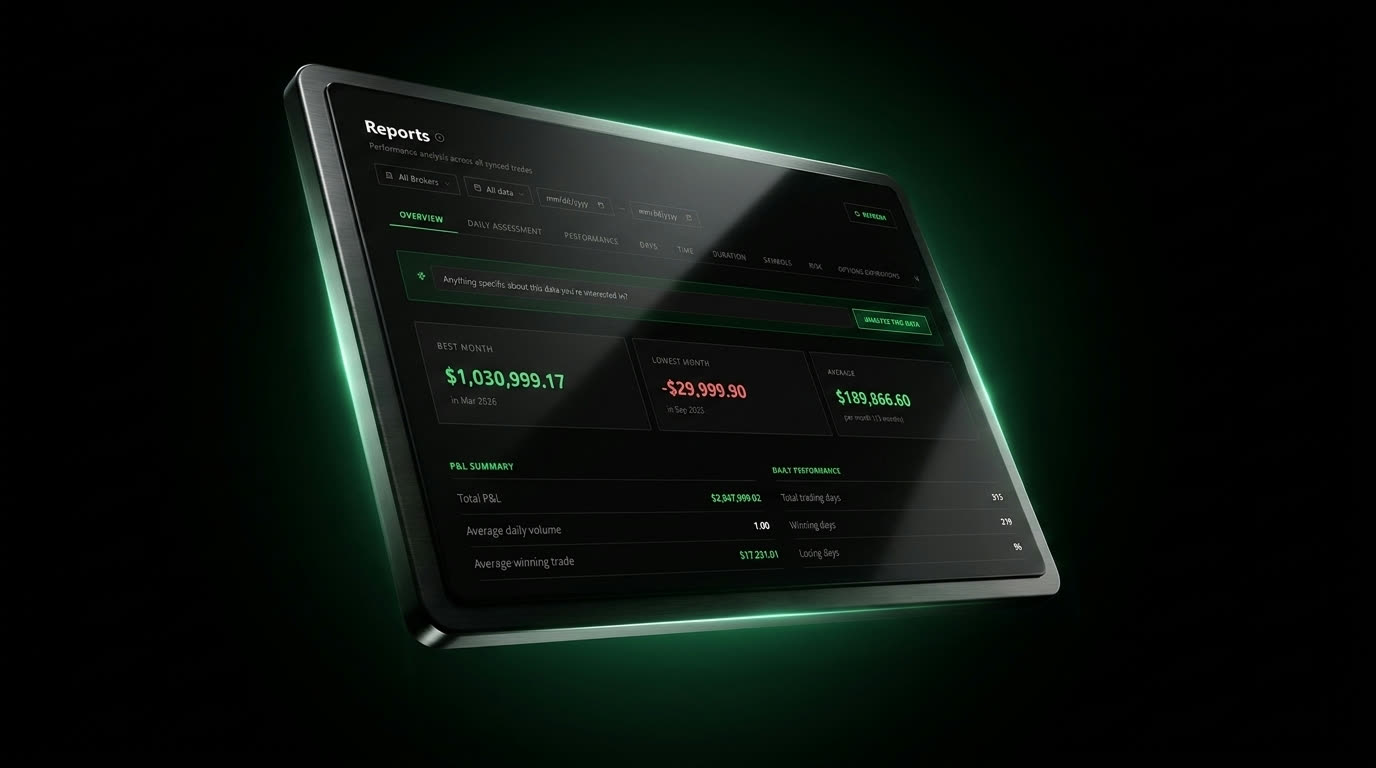
In-Depth Reports
Best month, worst month, win rate by day and session, streaks, and drawdowns — a full performance breakdown across every trade you've ever synced.
On the go
Your full dashboard, now on mobile
Everything above — broker sync, filters, charts, AI insights — redesigned for a phone screen. No stripped-down read-only view.
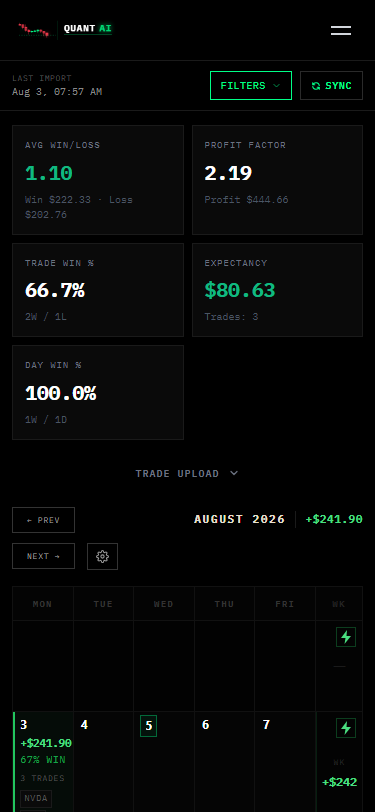
Stats, sync, and your calendar — at a glance
Your win rate, profit factor, and daily P&L calendar load the moment you open the app, synced from the same broker connection as desktop.
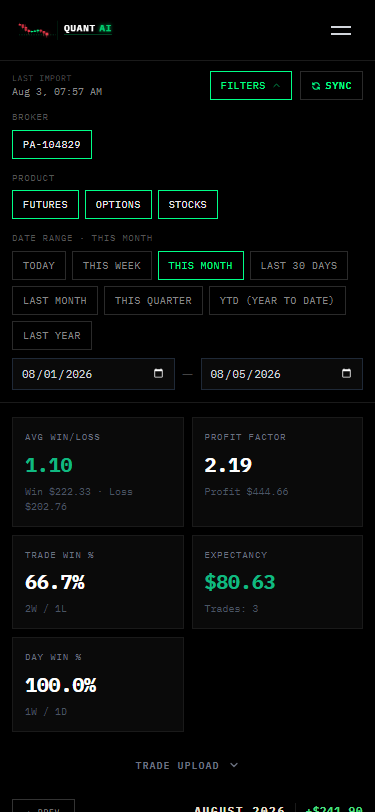
Filter by broker, product, and date range
The full desktop filter set — broker chooser, futures/options/stocks, and date presets — in a tap-to-expand mobile panel.
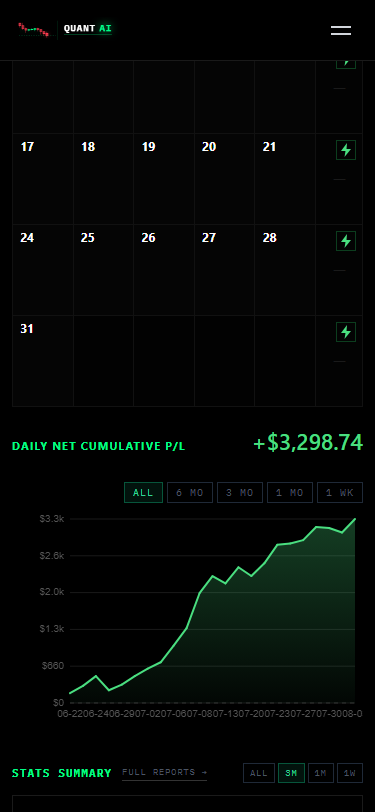
The same charts, not a stripped-down view
Cumulative P/L, drawdown, historical risk metrics, and performance trend all render full-size on your phone — nothing is desktop-only.
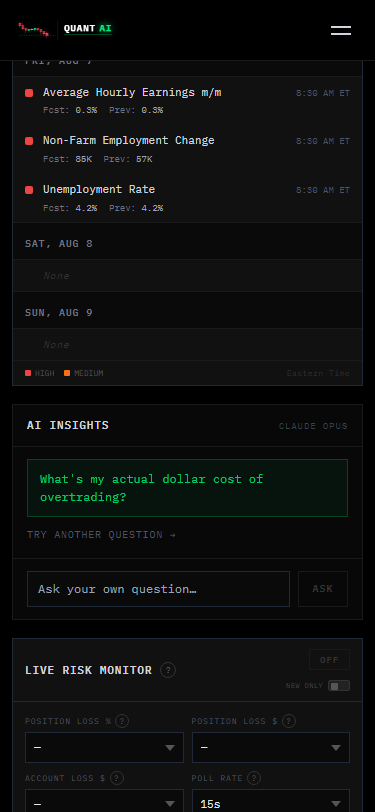
AI insights and live risk monitoring, anywhere
Ask Claude a question about your trading or check your live risk thresholds from the couch, the train, or the trading floor.
Simple setup
How it works
Connect your broker
Link your Schwab account with a single OAuth click, or upload a CSV from any broker in seconds. No manual entry, no friction.
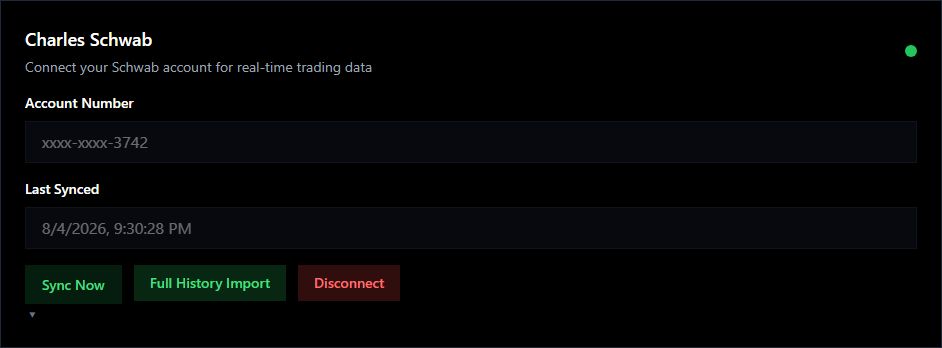
Your data syncs automatically
Trades, P&L, positions, and equity data flow into your dashboard. Always live, always accurate — no manual work required.
Get AI-powered edge
Run AI prompts on your data anytime. Ask anything about your trading — get specific, data-backed answers that expose your blind spots.
Inside the platform
Everything you need, in one place
Built for serious traders who want clarity, not clutter.

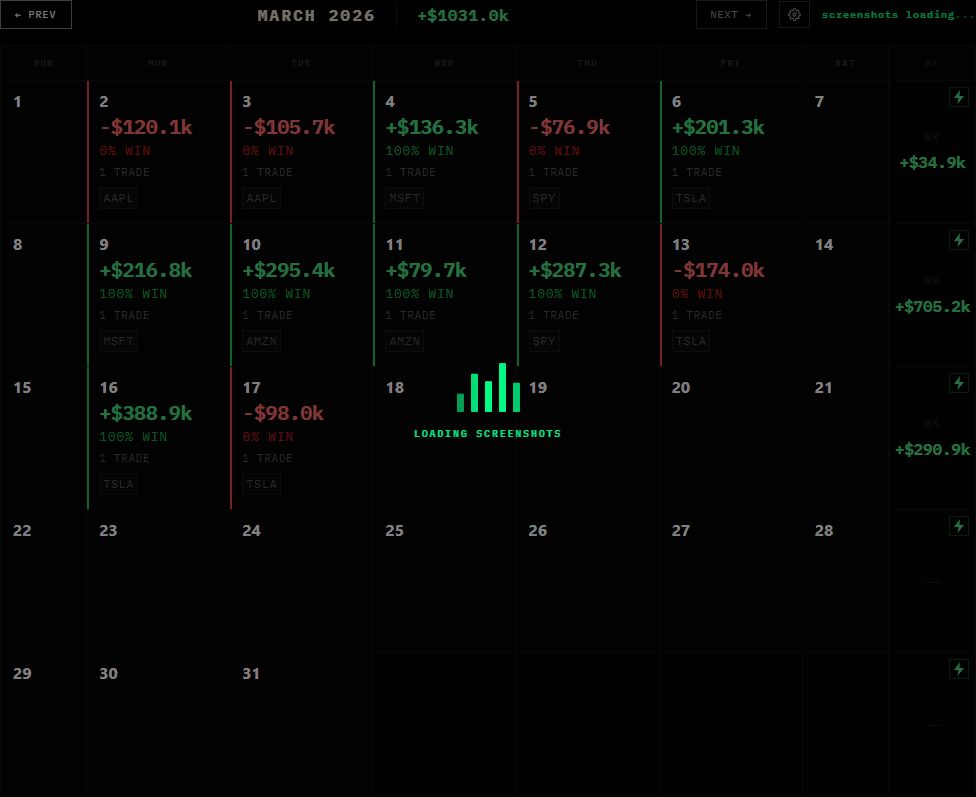
01 — Dashboard
Your trading command centre
See your P&L, equity curve, win rate, and key stats the moment you open the app. Broker-synced data means it's always live — no manual entry, no stale numbers.
- Live equity curve & drawdown tracking
- Daily P&L calendar heat-map
- AI insight panel with one-click analysis
- Automatic broker sync via OAuth
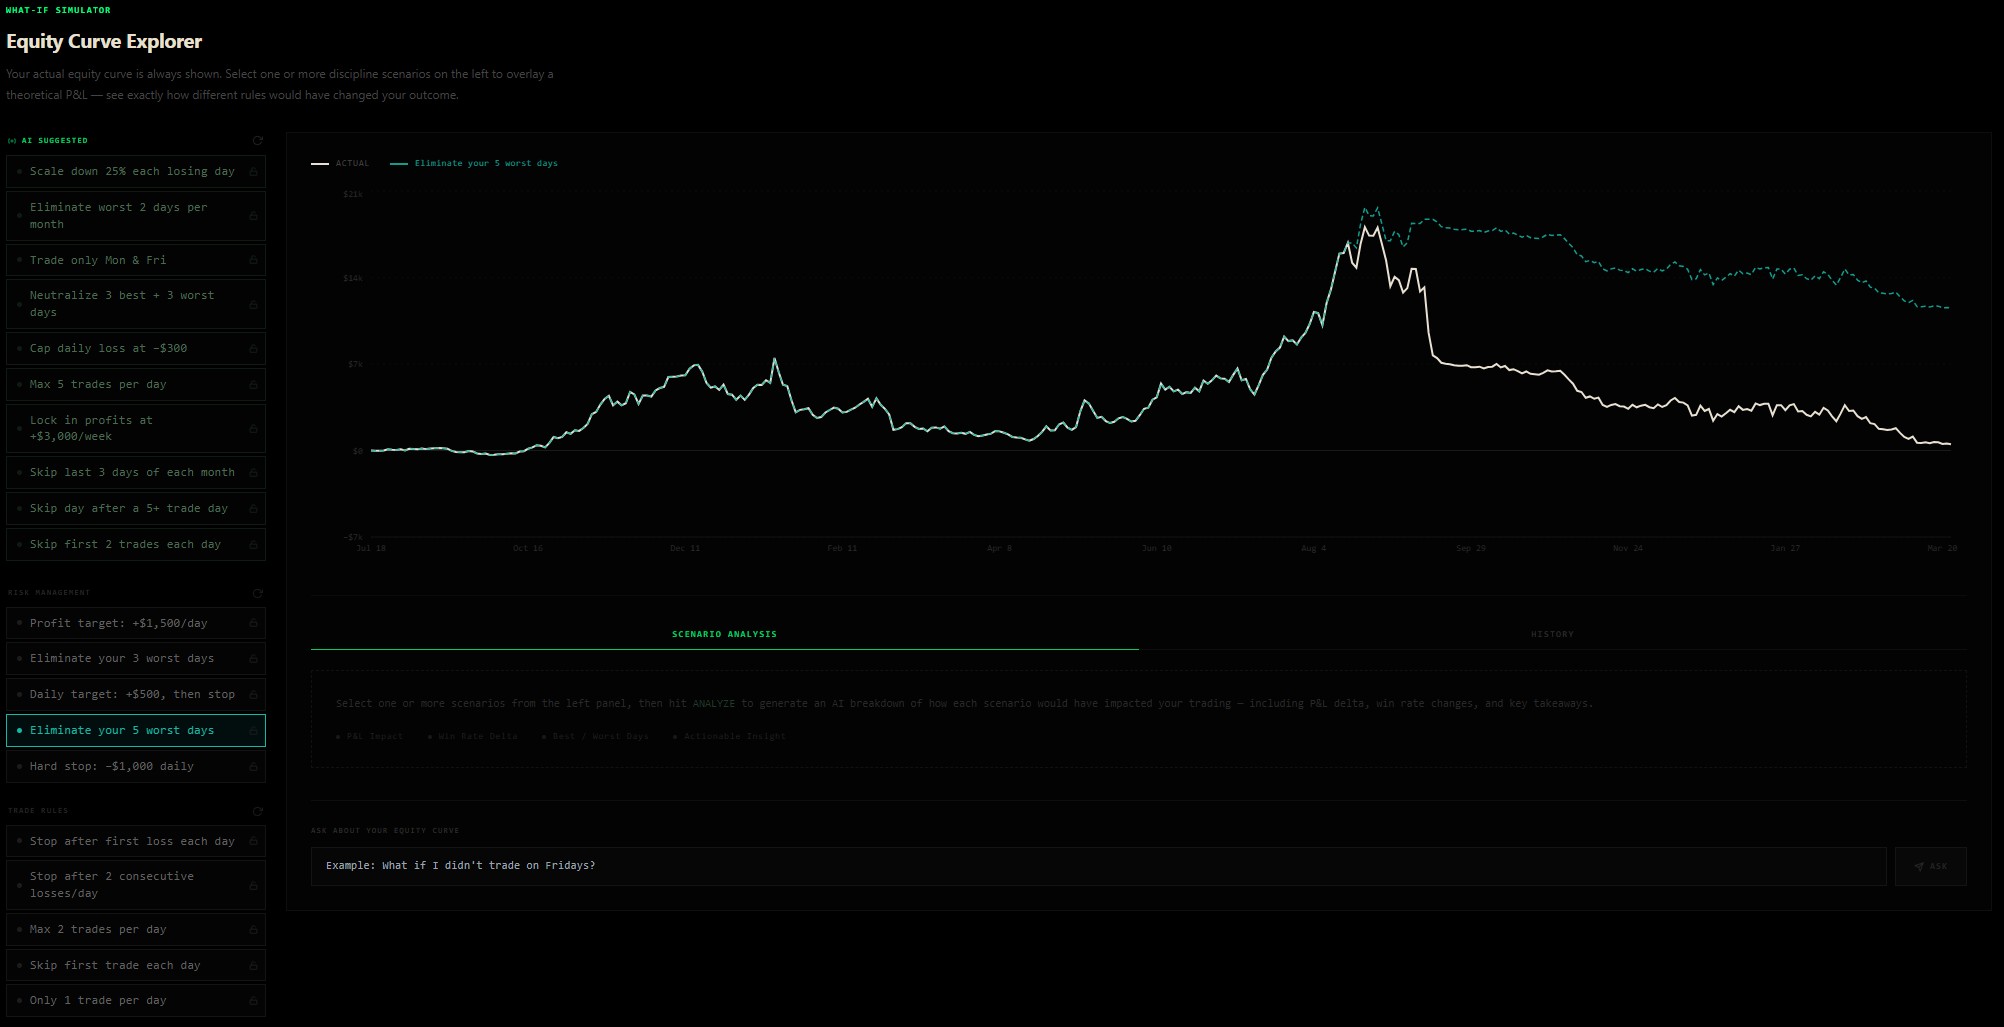
02 — Quant Lab
Ask anything about your trading
Run AI-powered prompts directly on your trade data. Backtest ideas, identify patterns, and get data-backed answers to questions you've never been able to answer before.
- Natural language queries on your trade history
- Pattern & strategy identification
- Custom prompt builder
- Monte Carlo scenario simulation

03 — Reports
Deep performance breakdowns
Slice your performance by symbol, session, day of week, setup, and more. Identify exactly where your edge is — and where you're leaking money.
- Win rate, avg R, expectancy by category
- Time-of-day & day-of-week analysis
- Streak tracking & drawdown stats
- Export-ready performance summaries

04 — Screenshots
Document trades with visual context
Attach chart screenshots directly to trades. Browse by month, select multiple screenshots, and run AI analysis across them to surface patterns your raw numbers miss.
- Chart screenshots linked to individual trades
- Month-by-month gallery view
- Multi-select with AI analysis
- Ask questions about your setups
Case studies
Traders who made the switch
“The AI told me I was revenge trading every time I had a red morning — I already knew it, but seeing it quantified with actual dollar amounts forced me to change. Up 31% since I fixed it.”

Marcus T.
Equities Day Trader · 4 yrs
“I had no idea my Thursday win rate was 38% vs 71% on Tuesdays. QuantAI found that in seconds. I stopped trading Thursdays and my month turned green immediately.”

Priya S.
Options Swing Trader · 2 yrs
“The broker sync alone is worth the subscription. My journal is always up-to-date without any manual work, and the equity curve visualization finally shows me the full picture.”

Jordan K.
Futures Trader · 6 yrs
Simple, transparent pricing
Ready to find your edge?
Starter is free forever. Pro & Elite include a 7-day free trial.
View Plans & PricingFAQ
Common questions
Start today
Stop guessing.
Start knowing.
Join traders who've replaced gut feelings with data. Starter is free.
View Pricing & Get Started