Blog · AI Insights
AI Insights Explained: How the Ask-AI Widget Actually Works
A dashboard widget that asks itself questions about your trading, answers them with Claude Opus, and never runs out of new ones to ask. Here's exactly what it sends, what it doesn't, and where the questions come from.
August 4, 2026 · 7 min read
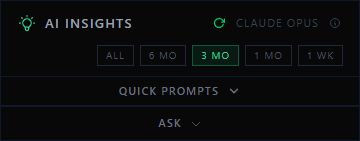
Most “AI trading insights” features are a chat box with a system prompt bolted on. AI Insights is built the other way around: it starts with a list of specific, pre-written questions about your own account, sends your actual trade history to Claude Opus to answer whichever one you pick, and then quietly writes itself a brand-new question to replace it — so the list is never the same twice.
The automated questions
The widget opens with 15 Quick Prompts pulled from a pool of pre-written questions like “What's my actual dollar cost of overtrading?” or “Which ticker is silently draining my account?” Each of the 15 slots is locked to one of four categories, evenly split:
Risk Management
stop placement, daily loss limits, position sizing, over-leveraging, cutting losers late
Entries
timing quality, chasing vs. waiting, entry price relative to key levels, signals that precede wins
Data & Stats
profit factor, expectancy per trade, win rate vs. payout ratio, outlier trades, sample size
Patterns & Behaviors
revenge trading, overtrading after losses, streak effects, FOMO, end-of-session giveback
That category split isn't cosmetic — it's enforced server-side. When a prompt gets refreshed, QuantAI asks Claude to write one brand-new question for that specific slot's category only, under a hard 10-word limit, and explicitly told what's already been asked so it doesn't repeat itself:
CATEGORY CONSTRAINT (risk-management):
Focus EXCLUSIVELY on risk management and capital
preservation — stop placement, daily loss limits,
position sizing, over-leveraging, cutting losers late...
Do NOT ask about entries, timing, or patterns.

Already used (do NOT repeat or closely paraphrase):
1. What's my actual dollar cost of overtrading?
2. Which ticker is silently draining my account?
...

Generate one brand-new question. MAX 10 WORDS.
You can hit the refresh icon to regenerate every unlocked prompt at once, or click the small lock icon on any prompt you want to keep around — locked prompts sit out the refresh. And every time you actually run a prompt, that one slot gets a freshly generated replacement automatically once the answer comes back, so the list keeps evolving on its own even if you never touch refresh.
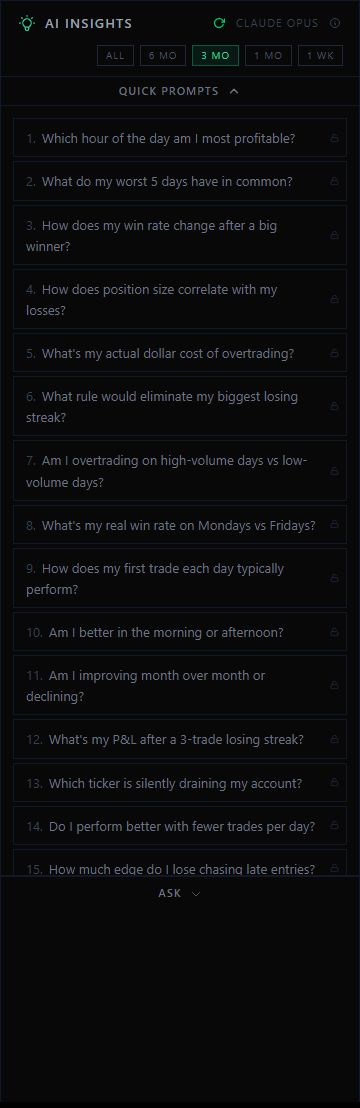
Prefer to ask your own thing? The Ask section underneath is a plain text box — type any question and it runs through the exact same pipeline as a Quick Prompt, against the exact same data.
What actually gets sent to Claude
This is the part worth being precise about, since it's your trading data leaving the app. Hovering the small (i) icon next to the model name shows the summary QuantAI discloses in the widget itself:
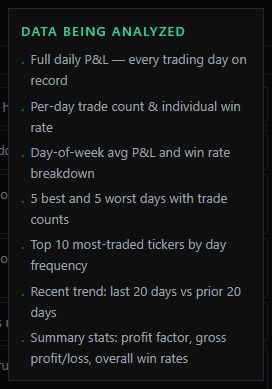
- Full daily P&L — every trading day on record
- Per-day trade count & individual win rate
- Day-of-week average P&L and win rate breakdown
- 5 best and 5 worst days, with trade counts
- Top 10 most-traded tickers by day frequency
- Recent trend: last 20 days vs. the prior 20 days
- Summary stats: profit factor, gross profit/loss, overall win rates
That's the aggregate picture — but under the hood, the request going to Claude carries more than the tooltip summarizes. QuantAI also assembles your individual trade records for the selected window (symbol, direction, quantity, entry/exit price, P&L, duration, tags) and appends them chronologically, so Claude isn't just reasoning over daily totals — it can reference a specific trade by date and ticker in its answer, which is why responses often read like “your Mar 5 TSLA trade lost $93,477 after a 4h47m hold” rather than a vague summary.
The window itself is controlled by the time-range filter above the prompt list — All, 6 Mo, 3 Mo, 1 Mo, or 1 Wk. Whichever one is selected is what gets filtered and sent; Claude is explicitly told the window it's working with and instructed to open its answer confirming that range, so there's no ambiguity about how far back an insight is actually looking.
None of your account credentials, personal information, or connected-broker tokens are part of this payload — only the trade performance data described above, scoped to whatever time range you have selected.
Reading an answer
Click a prompt (or hit Ask on a custom question) and the response streams in live, model set to claude-opus-4-5. Every finished answer is saved automatically to a History tab so you can come back to it later, and it opens with a note confirming the exact date range it analyzed — worth checking first, since a 1-week answer and an all-time answer can read very differently for the same account.
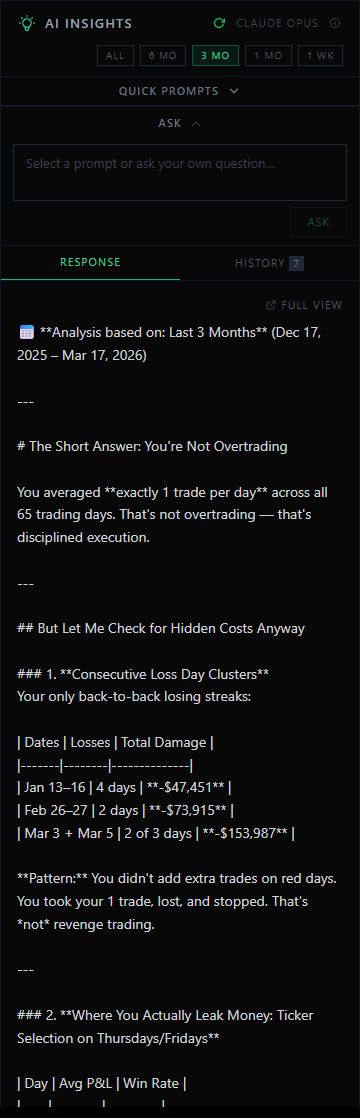
The system prompt behind this is deliberately blunt: Claude is told to act as “a brutally honest, sharp trading performance analyst,” to reference exact dates and numbers instead of generic advice, and to be direct. That's why answers tend to name specific losing streaks, specific tickers, and specific dollar amounts rather than saying something like “consider reviewing your risk management.”
See what it finds in your own trades
AI Insights is included starting on Starter.
View Plans & Pricing